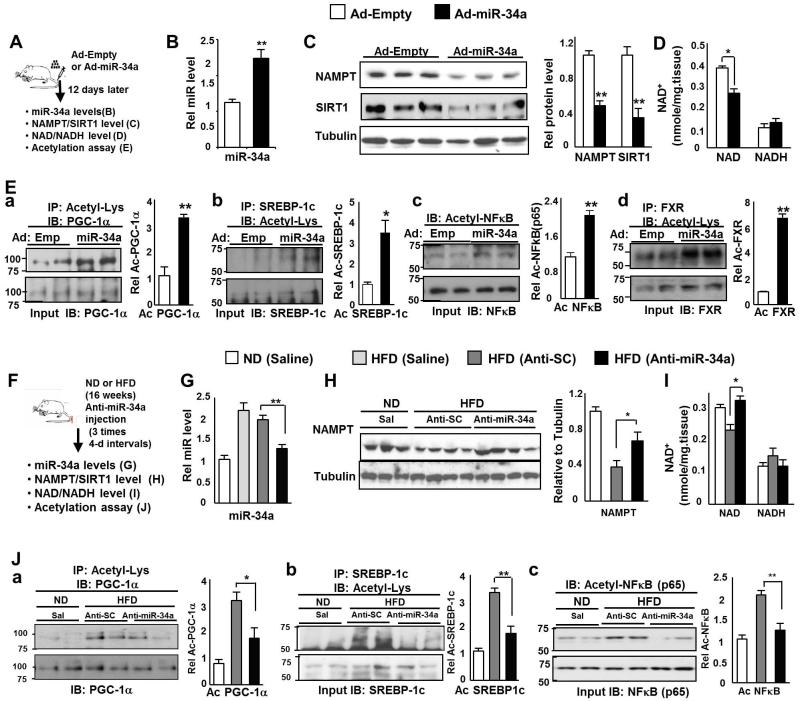
Fig. 3. Effects of miR-34a on hepatic NAMPT/NAD+ levels and SIRT1 activity.
(A-E) MiR-34a overexpression experiments in lean mice. (A) Experimental outline. (B) Hepatic miR-34a levels are shown. (C) NAMPT and SIRT1 protein levels are shown and the ratio of NAMPT or SIRT1 to tubulin is plotted (right panel). (D) Hepatic NAD+ and NADH levels are shown. (E) Acetylation of transcriptional regulators were detected by IP/IB and the ratio of acetylated to total protein is plotted in panels to the right. The mean and SEM are plotted (n=4), *, p<0.05, **, p<0.01, NS, statistically not significant. (F-J) Anti-miR-34a experiments in dietary obese mice. (F) Experimental outline. (G) Hepatic miR-34a levels are shown. (H) NAMPT protein levels are shown and the ratio of NAMPT to tubulin is plotted (right panel). (I) Hepatic NAD+ and NADH levels are shown. (J) Acetylated protein levels were detected by IP/IB and the ratio of acetylated to total protein is plotted in panels to the right. The mean and SEM are plotted (n=3-5), *, p<0.05; **, p<0.01, NS, statistically not significant.

