Fig. 3.
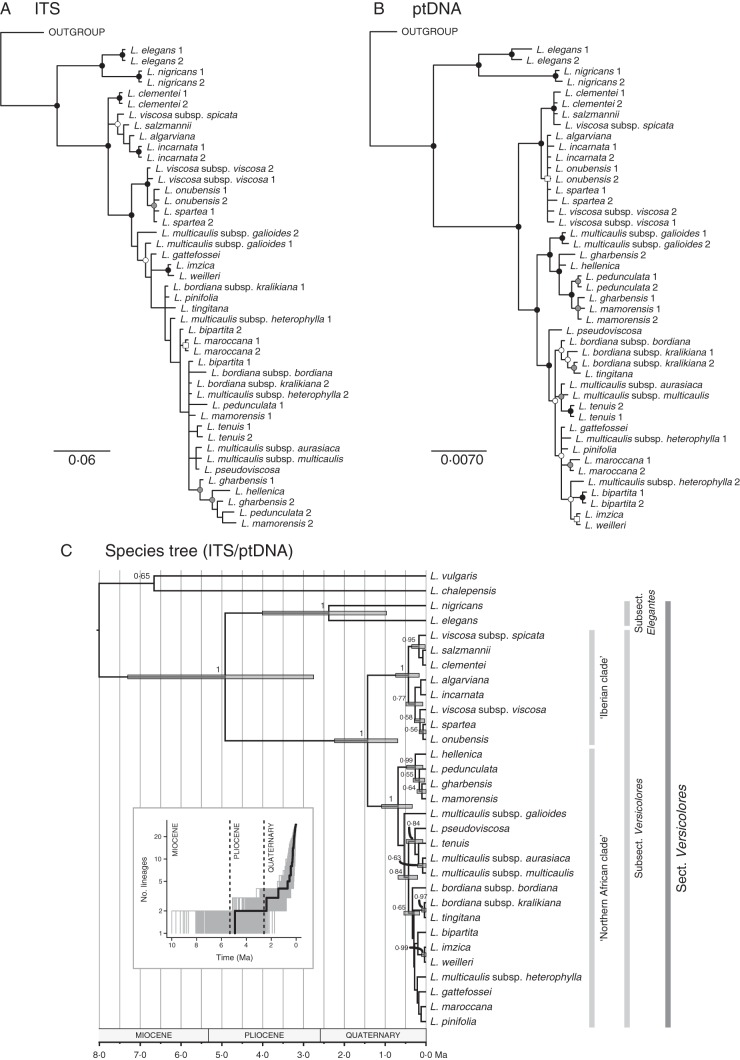
Phylogenetic analyses of Linaria sect. Versicolores. (A, B) Gene trees of ITS (A) and ptDNA (B) sequences. The 50 % majority rule consensus trees obtained in Bayesian analyses are shown. A black dot indicates clade support in BI (PP > 0·95), ML (ML – BS > 70 %) and MP (MP – BS > 70 %) analyses. A grey dot indicates support only in BI and ML analyses. A white dot indicates support only in the BI analysis. A white square indicates support only in the ML analysis. (C) Time-calibrated maximum clade credibility species tree obtained in the Bayesian *BEAST analysis based on ITS and ptDNA sequences. Node bars represent the 95 % highest posterior density intervals for the divergence time estimates. Numbers along the branches are Bayesian posterior probabilities. Major clades are named, including subsections following Sutton (1988). The inset shows a log-lineage-through-time plot for Linaria sect. Versicolores, based on 1000 trees randomly sampled from the posterior distribution of the *BEAST analysis. The thick line corresponds to the MCC species tree.

