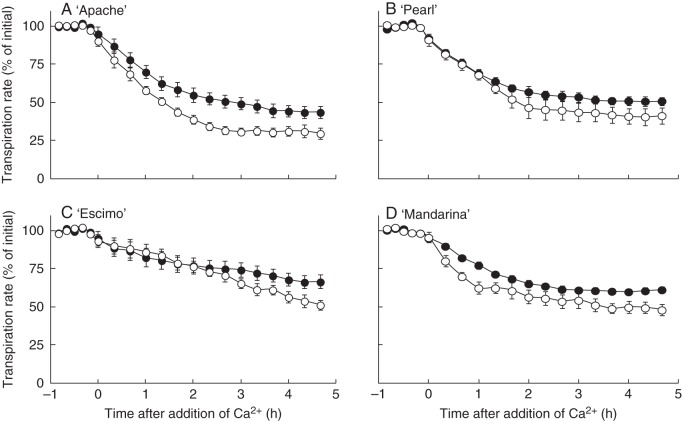
Fig. 7.
Leaflet transpiration rate as a function of time following feeding through the petiole with 8 mM Ca2+ of four pot rose cultivars grown at moderate (60 %, open symbols) or high (90 %, closed symbols) relative air humidity. The transpiration rate of leaflets placed in water was recorded for 1 h prior to the closing stimulus feeding (values are given in Table 2), and subsequent transpiration rates were expressed relative to that value i.e. [(transpiration rate in water)–(transpiration rate)]/(transpiration rate in water). Data are averages of eight replications ± SEM.

