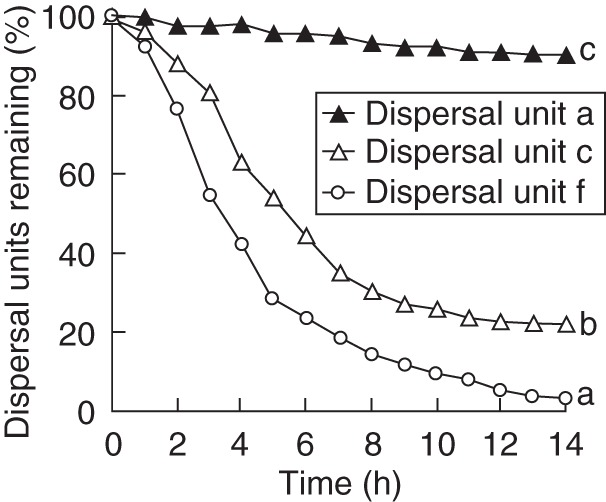
Fig. 2.

Depletion curves for dispersal units a, c and f removed by ants (mean ± s.e.). Significant differences in percentages of dispersal units remaining after 14 h are indicated by different lower case letters (Tukey's HSD, P < 0·05). Only standard errors ≥1·92 % are shown.
