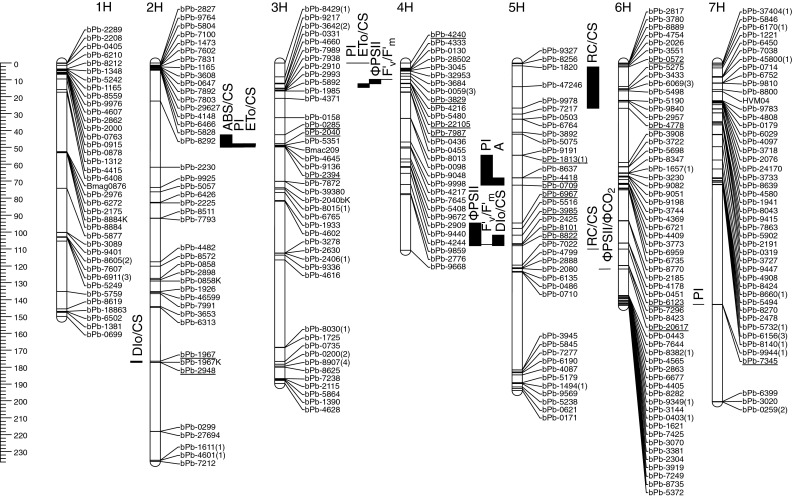
Fig. 1.

Linkage map for 331 DArT, 4 STS and 3 SSR markers reduced to 295 unique loci based on 182 F2 plants derived from the cross between malting barleys: STH754 × STH836 and position of quantitative trait loci (QTL) for stress indexes (SI) of different physiological characteristics. Genetic distances are shown in centiMorgans (cM) to the left of the vertical axis. Numbers in brackets refer to redundant markers
