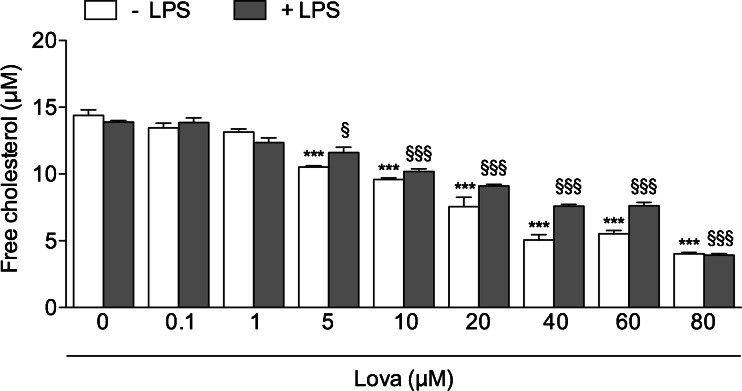
Fig. 3.
Cholesterol levels after lovastatin treatment on Raw 264.7-cells. Raw 264.7 cells (murine monocyte/macrophage cell line) were incubated with (0/0.1/1/5/10/20/40/60/80 μM) lovastatin for 20 h alone or with the addition of 10 μg/mL LPS for further 24 h. The bars represent the means of three independent experiments ± SD. Analyses were performed with one-way ANOVA and Bonferroni post-test. *p < 0.05; **p < 0.01; ***p < 0.001 vs. 0 μM Lova (white bars); §p < 0.05; §§p < 0.01, §§§p < 0.001 vs. LPS + 0 μM Lova (grey bars)

