
Figure 2.
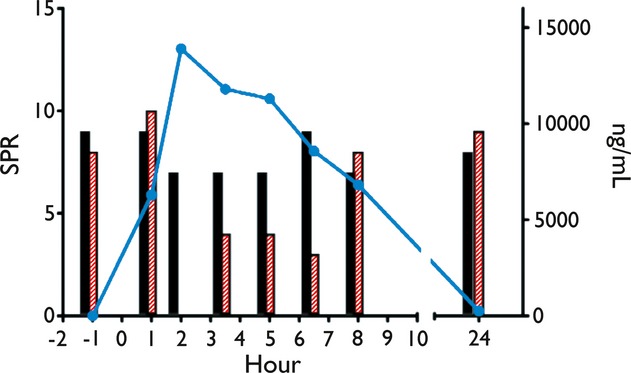
Plot depicting response to IPS and plasma concentrations of ICA-105665 for a single subject dosed at 400 mg. Filled bars represent SPR on day 1 (placebo) and hatched bars represent SPR on days 2 and 3 (ICA-105665). An exception is the black bar plotted at the 24 h time point. For comparative purposes this SPR value is from predose on day 2 and is therefore represented twice on the plot (predose as a hatched bar and 24 h as a filled bar). SPR is on the left y-axis. Filled circles and connecting lines represent ICA-105665 plasma concentration (right y-axis). For ease of viewing, the x-axis is broken into two segments. The left represents predose to 12 h and the right represents 24–28 h postdose.