
Figure 2.
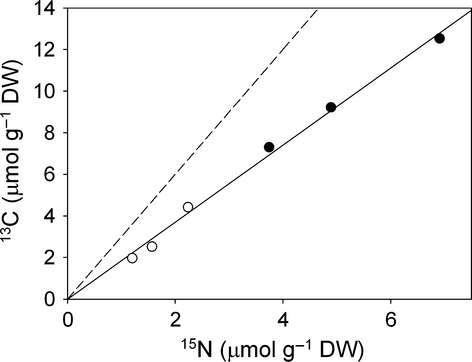
Concentrations of 15N and 13C recovered in tissues of wheat (Triticum aestivum) plants grown in sterile culture after supply of 15N13C-dual-labelled l-alanine or l-tetraalanine. Values are data for individual plants. The solid line is the line of best fit using data for plants supplied with both alanine and tetraalanine (r2 = 0.994; slope = 1.85). The dashed line represents the relationship between 15N and 13C in the compounds supplied to roots. Closed circles, alanine; open circles, tetraalanine.