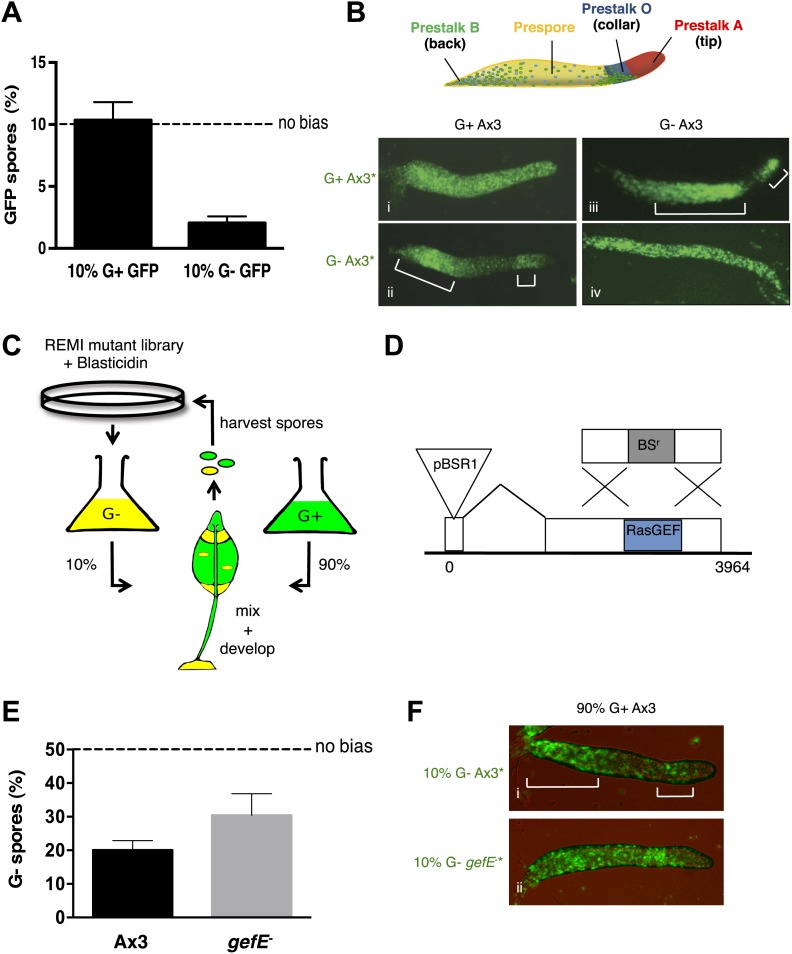
Figure 1. RasGEFE mutant cells are enriched in a genetic screen for modulators of nutritional bias.
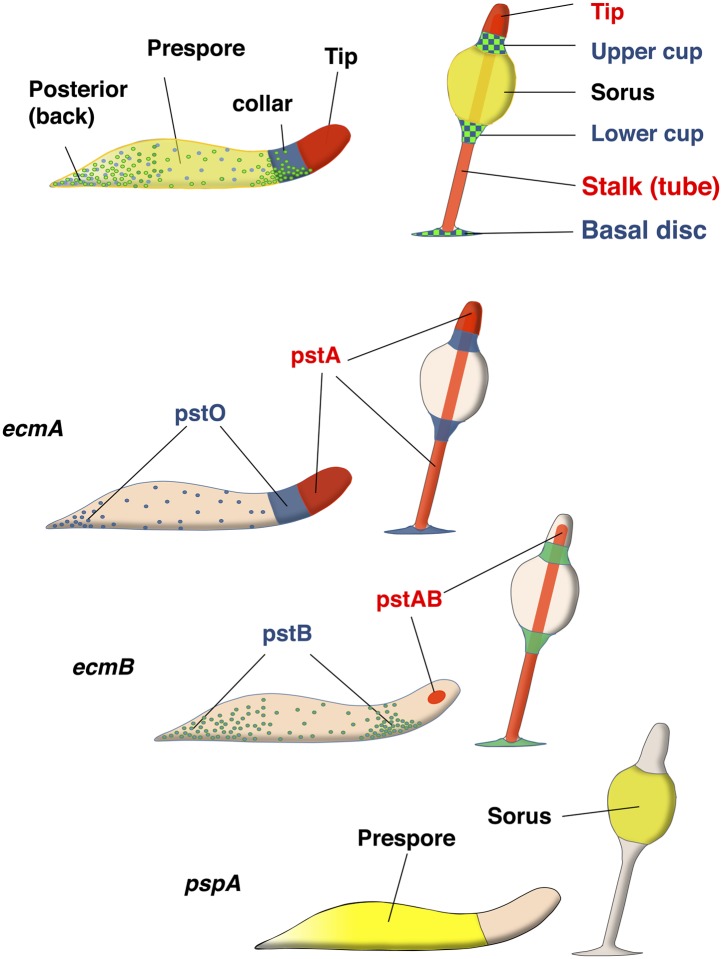
(A) G− cells produce fewer spores than G+ cells in chimeric development. GFP-labelled Ax3 wild type cells were grown in either G+ or G− conditions and mixed 10:90 with wild type G+ cells. GFP spores were quantified by counting. Dotted line indicates the percentage GFP spores expected if there is no fate bias. Error bars represent SEM, p<0.0001. (B) G− growth biases cells towards pstO and pstB cell fates. Diagram shows organisation of different cell types along the anterior-posterior axis of the Dictyostelium slug. Patterning of GFP-labelled (*) G+ (i) and G− (ii) cells when mixed at 10:90 ratio with G+ cells. The reciprocal pattern was observed when GFP-labelled G+ (iii) and G− (iv) were mixed at 10:90 ratio with G− cells. (C) Schematic diagram of the genetic selection. REMI mutant cells were grown in G− and mixed 10:90 with wild type G+ GFP cells. Chimeric fruiting bodies were harvested and spores returned to growth medium after each developmental cycle. Wild type cells were removed with Blasticidin. (D) Generation of gefE− mutants. REMI plasmid, pBSR1, inserted into 42 bp exon 1. RasGEF catalytic domain (blue) deleted by homologous recombination. (E) gefE− mutant cells produce more spores than Ax3 wild type cells after G− growth. RFP-labelled wild type cells were grown in G+ medium and mixed at a 50:50 ratio with unlabelled wild type or gefE− mutant cells grown in G−. Number of unlabelled spores was quantified by counting. Error bars represent SEM, p<0.04. (F) Comparison of the patterning of GFP-labelled (*) wild type (i) or gefE− mutant (ii) cells grown in G− conditions when mixed at 10:90 ratio with unlabelled wild type G+ cells. AP axis in all slug images oriented from right-left with white bars showing regions of GFP enrichment.


