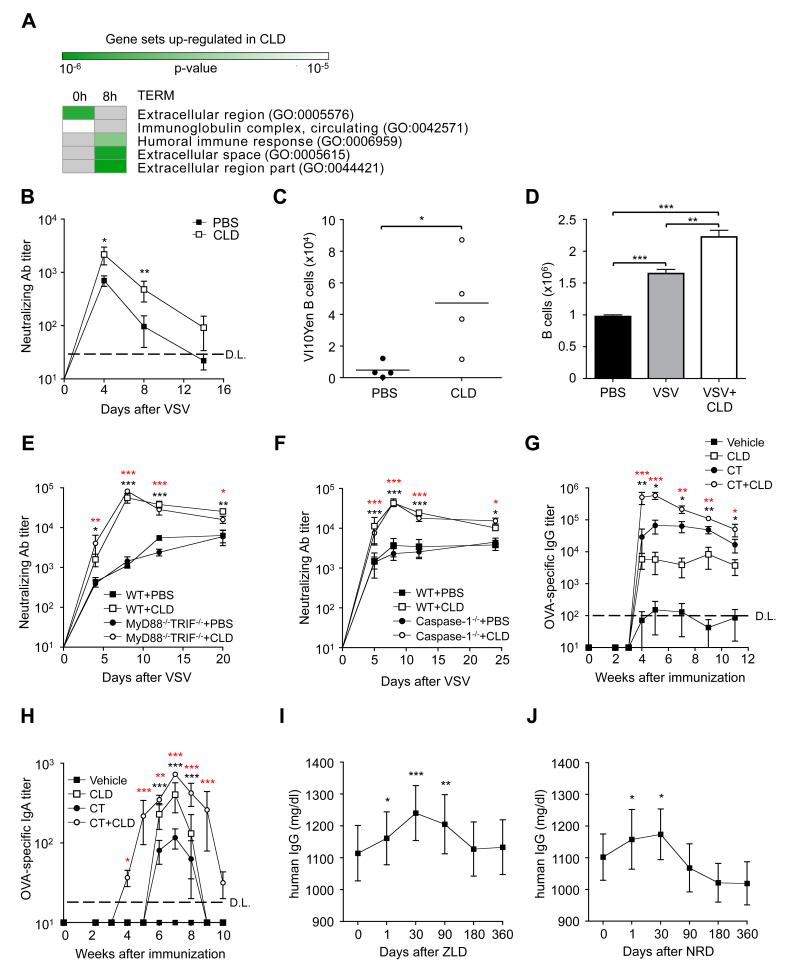
Figure 3. Bisphosphonates Directly Target B Cells and Enhance B Cell Expansion and Antibody Production upon Antigen Encounter Independently of Toll-Like Receptor Signaling or the Inflammasome.
(a) Gene enrichment analysis of clodronate-dependent genes from microarray measurements of whole lymph node. Shown are the Gene Ontology (GO) terms (rows) statistically enriched among the 156 genes with at least a 2-fold increase in expression at 0 and 8 hours (columns) after VSV infection in clodronate (CLD)-treated mice compared to control (PBS). Enriched GO term categories include BP: biological process, and CC: cellular component. Green: p value < 10-6; white: p value < 10-4; grey: no enrichment. See Methods for details. (b) VSV nAb titers in the serum of DHLMP2A mice that were intravenously transferred with PBS- or CLD-treated VI10Yen B cells 24 hours prior to footpad VSV infection. n = 6 per group; results are representative of 2 independent experiments. (c) Quantification of the total number of VI10Yen B cells recovered from the spleen of the mice described in Figure 3B, 8 days after VSV. (d) Quantification of the total number of cells recovered 48h upon in vitro culture of purified VI10Yen B cells with PBS, VSV or 10nM clodronate and VSV. (e) VSV nAb titers in the serum of C57BL/6 (WT) or MyD88−/−/Trif -/- mice that were footpad injected with PBS or CLD immediately prior to VSV infection in the same footpad. n = 4 per group; black asterisks, WT + PBS versus WT + CLD; red asterisks MyD88−/−/Trif−/−+PBS versus MyD88−/−/Trif−/−+CLD; results are representative of 3 independent experiments. (f) VSV nAb titers in the serum of C57BL/6 (WT) or Caspase-1−/− mice that were injected in the footpad with PBS or CLD immediately prior to VSV infection in the same footpad. n = 10 per group; black asterisks, WT+PBS versus WT+CLD; red asterisks Caspase-1−/−+PBS versus Caspase-1−/−+CLD; results are representative of 3 independent experiments. (g) Ovalbumin (OVA)-specific IgG titers in the serum of C57BL/6 mice that were immunized orally with OVA alone (vehicle), OVA + CLD (CLD), OVA + cholera toxin (CT) or OVA + cholera toxin + CLD (CT + CLD). n = 5 per group; results are representative of 2 independent experiments. (h) OVA-specific IgA titers in the feces of the mice described in Figure 3G. (i) Total IgG in the sera of patients immediately prior to or at the indicated time points after a single intravenous infusion of zoledronate (ZLD). n = 11; see Suppl. Table 2 for patients characteristics. (j) Total IgG in the sera of patients immediately prior to or at the indicated time points after a single intravenous infusion of neridronate (NRD). n = 9; see Suppl. Table 2 for patients characteristics.
***: P < 0.001; **: P < 0.01; *: P < 0.05; D.L.: detection limit.
See also Figure S5-11.

