
Figure 2.
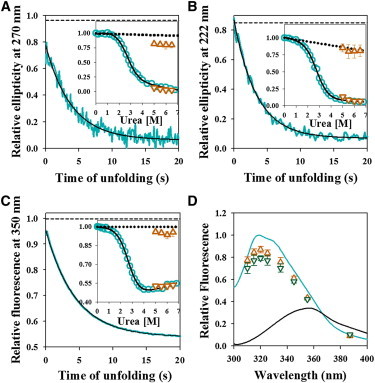
Dissolution of structure during unfolding monitored by multiple spectroscopic probes. (A–C) Representative kinetic traces of the unfolding of Cys-82 monitored by the change in near-UV CD signal at 270 nm (A), far-UV CD signal at 222 nm (B) and fluorescence intensity of W53 at 350 nm (C) are shown. In each panel, the solid cyan line represents the kinetic trace, the solid black line through the data is a fit to a single exponential equation, and the black dashed line represents the expected signal of native protein at 5.5 M urea, obtained from linear extrapolation of the native protein baseline of an equilibrium unfolding curve. In each panel, the inset shows the comparison between equilibrium and kinetic amplitudes. The cyan circles represent the equilibrium unfolding transition, and the solid black line is the fit to a two-state N ↔ U model. The brown triangles and inverted brown triangles represent t = 0 and t = ∞ signals, respectively, obtained from the fitting of the kinetic traces to a single exponential equation. The error bars represent the standard deviations of measurements from three separate experiments. The dotted line shows the native protein baseline. (D) Comparison of fluorescence spectra of barstar in equilibrium and kinetic measurements. Emission spectra in the N state (solid cyan line), the U state (solid black line), as well as the t = 0 (brown triangles) and t = 0.5 s (green inverted triangles) time points from the kinetic unfolding traces are shown, upon excitation of W53 at 295 nm. The spectra are normalized to the native signal of 1 at its emission maximum. The error bars for the t = 0 and t = 0.5 s fluorescence signals represent the standard deviations of measurements from three separate experiments. To see this figure in color, go online.