
Figure 5.
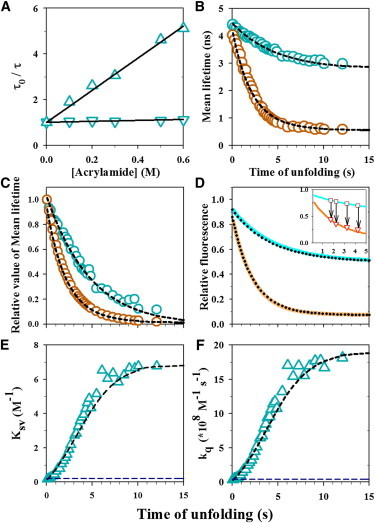
Quenching of W53 fluorescence by acrylamide. (A) Stern-Volmer plots for W53 quenching in the N (inverted triangles) and U states (triangles) of Cys-82. The mean fluorescence lifetime of W53 was measured in absence (τ0) and in presence of acrylamide (τ), and τ0/τ is plotted as a function of acrylamide concentration. The solid lines through the data are fits to a linear equation with an intercept of 1, and the slope is the Stern-Volmer constant (KSV) from which the kq values were calculated (see Materials and Methods). (B and C) Unfolding kinetics of barstar in 5.5 M urea and 10°C was monitored by measurement of the changes in the τm of W53 during unfolding in the absence (o, cyan) and presence (o, brown) of 0.6 M acrylamide (panel B). The kinetic traces have been normalized to between values of 1 for completely native protein and 0 for completely unfolded protein (panel C).The dashed black lines through the kinetic traces are fits to a N → IL → U model (Eq. S14 and Eq. S16, see the Supporting Material). The fits yield apparent rates for the N → IL and IL → U steps of 0.48 and 0.22 s−1, respectively. The mean lifetimes for N, IL, and U obtained from the fit were 4.20, 0.74, and 0.54 ns, respectively, in the presence of 0.6 M acrylamide, and 4.45, 3.75, and 2.80 ns, respectively, in its absence (panel B). (D) Unfolding kinetics of barstar monitored by fluorescence intensity measurement at 350 nm. Kinetic traces of the unfolding of barstar in the absence (solid cyan line) and presence (solid brown line) of 0.6 M acrylamide are shown. Each kinetic trace is normalized to the native signal of 1 in the absence of acrylamide. The solid lines through the data are fits to the three-state N → IL → U model (Eq. S13 and Eq. S15). The fits yield apparent rates for the N → IL and IL → U steps of 0.46 and 0.22 s−1, respectively. The fluorescence intensities for N, I and U obtained from the fits were 0.92, 0.70, and 0.50, respectively, in the absence of acrylamide, and 0.86, 0.10, and 0.07, respectively, in the presence of 0.6 M acrylamide. The inset in panel D shows the data from the interrupted unfolding experiment. The solid cyan and brown lines represent the unfolding kinetic traces in the absence and presence of 0.6 M acrylamide, respectively. The brown squares represent the fluorescence signals of protein unfolding in the absence of acrylamide, before the addition of 0.6 M acrylamide, and the red triangles represent the fluorescence signals immediately attained upon the jumps in acrylamide concentration to 0.6 M. The arrows connecting the fluorescence signals before and after the addition of acrylamide, indicate the times at which unfolding was interrupted. (E and F) Evolution of the Stern-Volmer constant (KSV) and bimolecular fluorescence quenching constant (kq) during unfolding. KSV (panel E) and kq (panel F) values (Δ) were calculated at each time point during unfolding from the τm values (see Materials and Methods of the Supporting Material), and are plotted as a function of unfolding time. The black dashed line through the data is a simulated fit (see Materials and Methods) to the N → IL → U model, using parameter values from the fits to the data in panel B. The dashed blue line represents the value for the N state. To see this figure in color, go online.