
Figure 5.
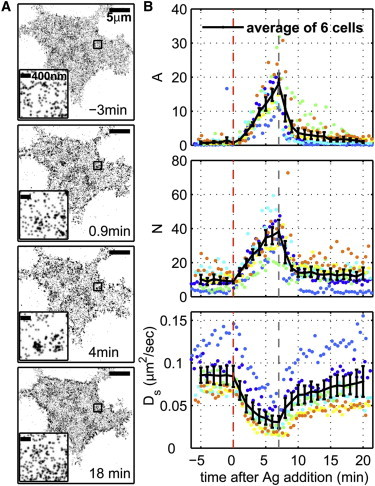
Antigen-induced changes in receptor clustering and mobility are reversible. (A) Reconstructed images of an AF647-IgE-labeled living cell before and after stimulation and subsequent addition of DCT. Each image is reconstructed from 80 s of acquired data. (Insets) Magnifications of the boxed regions in the main image. DNP-BSA (0.1 μg/ml) was added at 0 min, and DCT (200 μM) was added at 7 min. (B) The parameters A, N, and Ds are calculated as in Figs. 1C and 2C. The average values of A, N, and Ds, indicated by black lines, for six live-cell experiments distinguished by different colors, over the time course of stimulation and DCT addition. Antigen addition is indicated by the orange dashed line at 0 min, and DCT addition is indicated by the gray dashed line at 7 min. To see this figure in color, go online.