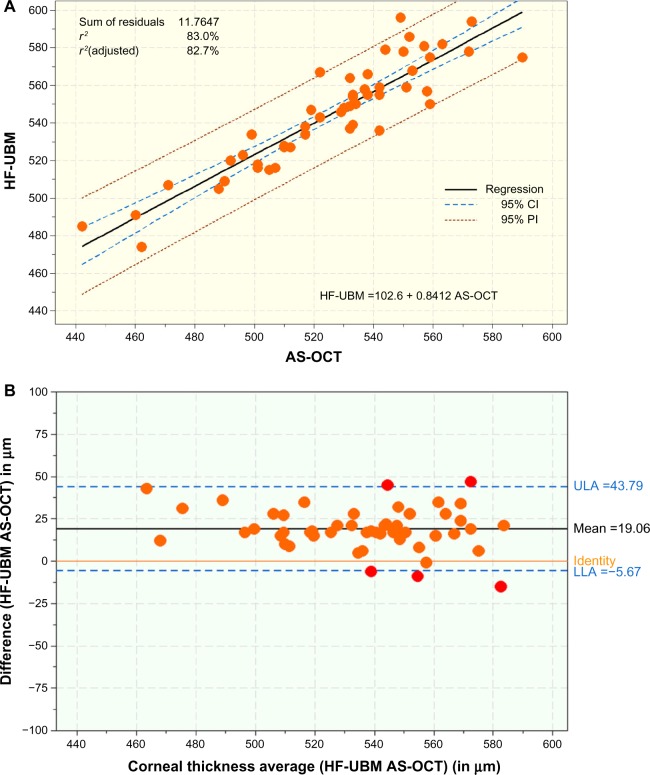
Figure 4.
(A) Scatter diagram showing the regression line of CCT measurements (μm) between HF-UBM and AS-OCT with coefficient of determination (r2). (B) Bland-Altman plot comparing CCT measurements (μm) HF-UBM and AS-OCT measurements (μm), mean bias and 95% upper and lower limits of agreement.
Abbreviations: AS-OCT, anterior-segment optical coherence tomography; CCT, central corneal thickness; HF-UBM, high-frequency ultrasound biomicroscopy; CI, confidence interval; LLA, lower limit of agreement; ULA, upper limit of agreement; PI, prediction interval.

