
Figure 4. iPN Inhibition of vlpr Neurons Is Odorant-Specific.
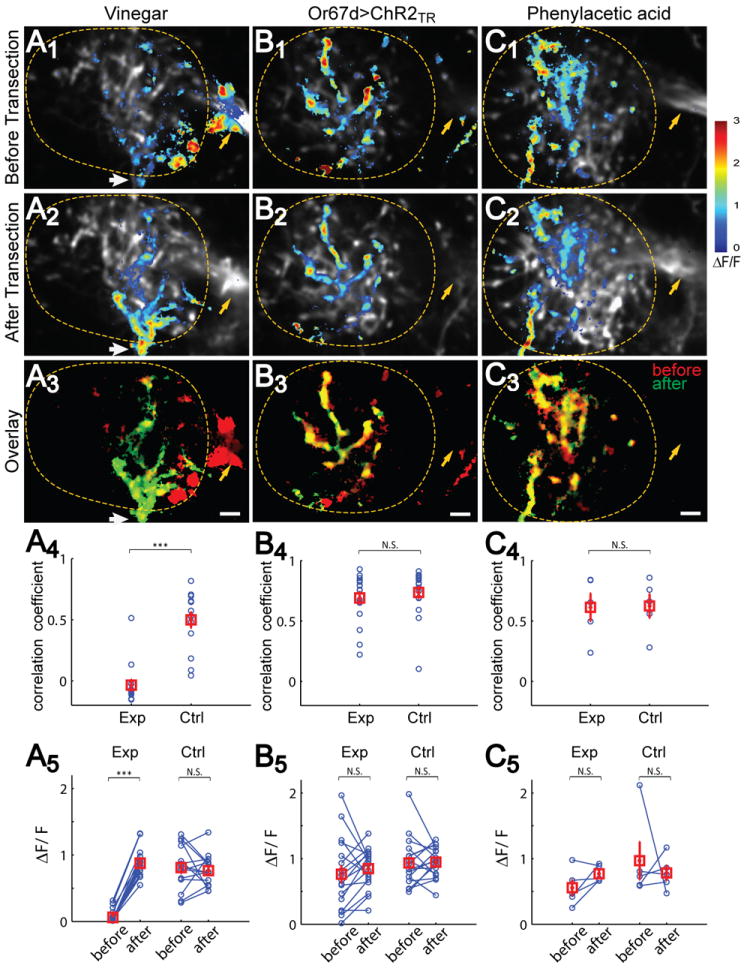
(A1-C3) Ca2+ responses to 1% apple cider vinegar (A), optogenetic activation of Or67d ORNs (B) and 1% phenylacetic acid (PAA) (C) are shown as representative images before (A1-C1) or after (A2-C2) mACT transection, and their overlay (A3-C3). Whereas the spatial patterns of vinegar response changes drastically after mACT transection, including signal loss in mACT (yellow arrows) and medial lateral horn and signal gain in vlpr dendrite entry site at the ventral lateral (white arrows), few changes are seen in Or67d and PAA responses before and after transection. Lateral horns are outlined. Scale, 5 μm.
(A4-C4) Correlation coefficients of spatial patterns of Ca2+ response for before- and after-transection. For vinegar, the average correlation before vs after is close to 0 and significantly smaller than that in the control hemisphere (paired t-test) (A4). For Or67d and PAA stimuli, the correlation coefficients in experimental hemispheres are comparable to the control hemispheres. (A5-C5) Quantification of ΔF/F across different animals for the three stimuli in ROI created by after-transection responses. mACT transection leads to a drastic increase in vlpr neuron response to vinegar stimulation (n=14, paired t-test), but not to OR67d>ChR2TR (n=17) or PAA (n=5) stimulation. In all cases, Ca2+ signals in the control hemisphere are not significantly changed. With repeated measures two-way ANOVA, mACT transection, brain hemisphere (experiment vs. control) and their interaction are all statistically significant (p < 0.001) to vinegar stimulation but none in the case of Or67d>ChR2TR or PAA stimulation.
See Figure S2 for Or67d>ChR2TR characterization in the antennal lobe, Figure S4 for characterization of in mammalian neurons, Figure S5 for characterization of Or67d-QF and QUAS-ChR2TR transgenes, and Figure S6 for dependence of vlpr response to Or67d>ChR2TR stimulation intensity.