
Figure 1.
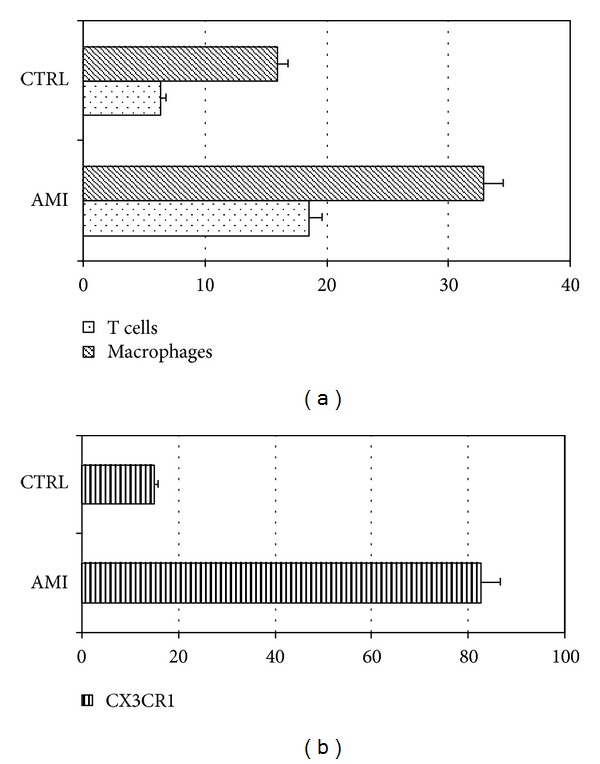
Inflammatory cells characterization. (a) shows the percentages of inflammatory cells, T lymphocytes (dotted bar) and macrophages (dashed bar) in AMI and control group. (b) Shows the percentages of T cells CX3CR1 positive in AMI and control group.