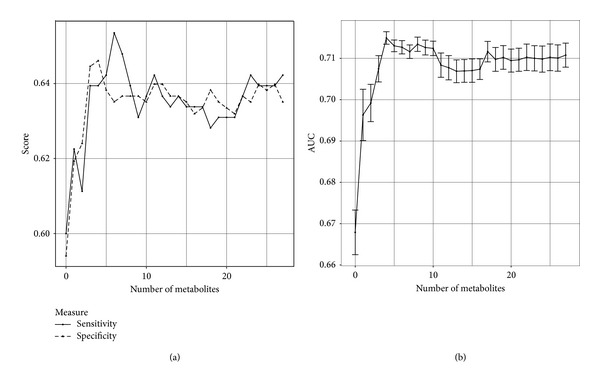
Figure 2.

Performance of LASSO with a varying number of metabolites. Two graphs showing performance for LASSO as we vary the number of metabolites used in addition to the clinical features. (a) shows sensitivity and specificity at the selected threshold point, and (b) shows AUC for the entire ROC curve along with standard error. Note that the graphs do not show the full range [0, 1] of the y-axis.
