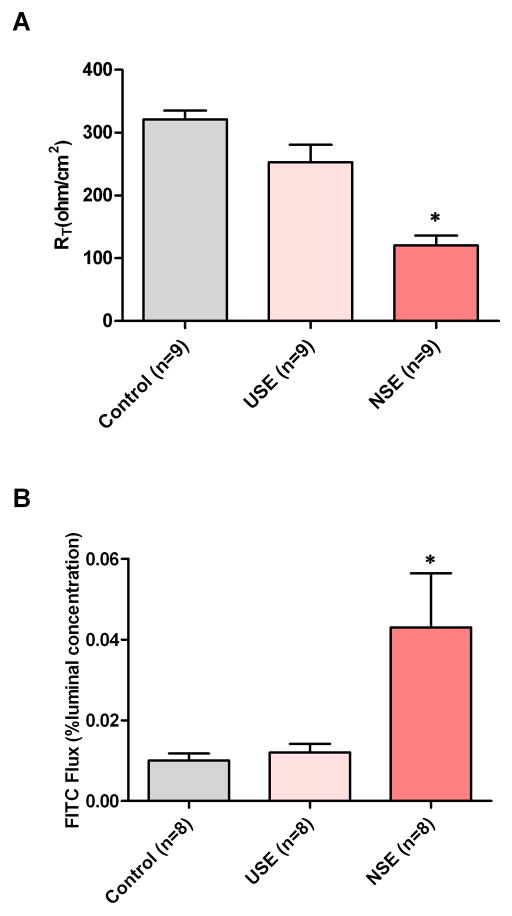
Fig. 2.
The transepithelial electrical resistance (RT) (upper panel) and fluorescein flux (lower panel) are illustrated for neosquamous epithelium (NSE), native esophageal upper squamous epithelium (USE) from the same patients, and healthy native distal squamous epithelium from subjects without esophageal disease (controls). Note that NSE has significantly lower RT and higher fluorescein flux values than both USE and healthy controls indicating higher paracellular permeability to ions and uncharged molecules, respectively. * p<0.05 compared to healthy controls.

