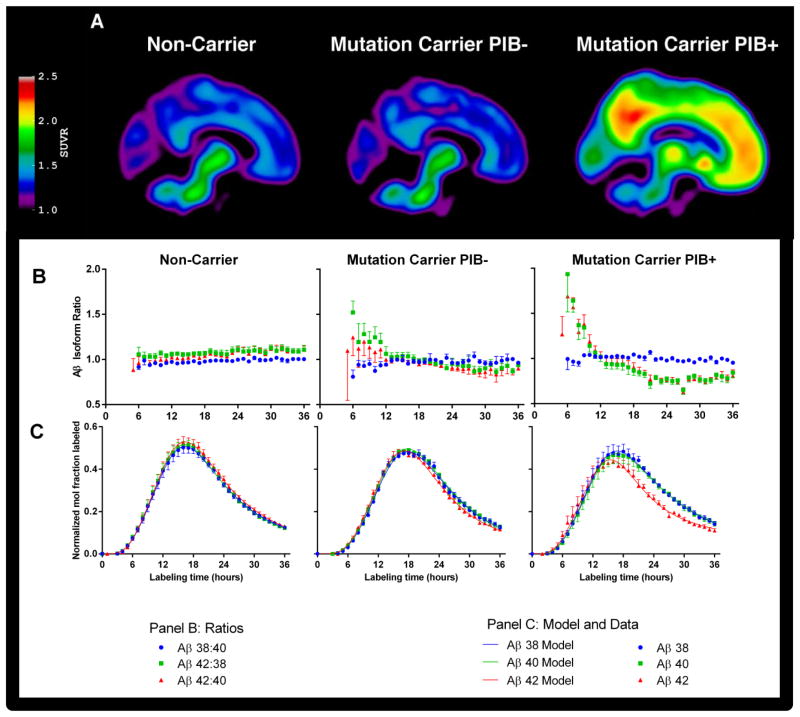
Fig. 1. PET images and isotopic enrichment time course profiles of CSF Aβ peptides.
(A) Composite PET images showing [11C]Pittsburgh compound B binding in participants who are non-carriers of PSEN mutations (left column), and PSEN mutation carriers who lack (PIB−, middle column) or have (PIB+, right column) evidence of amyloidosis. (B, C) Average Aβ isotopic kinetic time course profiles in CSF showing the Aβ42:40, Aβ38:40, and Aβ42:38 isotopic enrichment ratios (B, middle panel: Aβ38:40, blue circles, Aβ42:38 green squares, and Aβ42:40 red triangles) and as enrichment ratios normalized to plasma leucine plateau enrichments (C, lower panel: Aβ38 blue circles, Aβ40 green squares, Aβ42 red triangles). Aβ38 and Aβ40 present similar labeling profiles in all subject groups, whereas Aβ42 kinetics deviate from Aβ38 and Aβ40 only in mutation carriers, as evident in the Aβ42:40 and Aβ42:38 ratio profiles. Data points represent the mean ± SD for group-averaged values, and the solid lines represent the model fits to the data using the model in Fig. 2.

