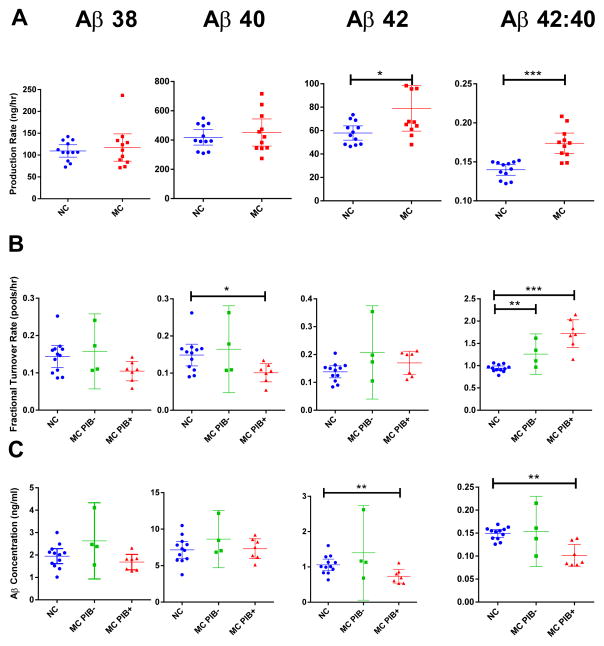
Fig. 3. Aβ concentrations and selected kinetic parameters.
Parameters for Aβ production rate (A), fractional turnover rate (FTR) (B), and baseline CSF concentrations (C) are shown for each group by mutation status and without (PIB−) or with (PIB+) evidence of amyloid deposition. Each parameter was measured for Aβ38 (1st column), Aβ40 (2nd column), Aβ42 (3rd column) and the Aβ42: Aβ40 ratio (4th column), and compared by mutation status and amyloid deposition. Error bars indicate 95% confidence intervals (CI). Mutation status compared when amyloid deposition did not affect magnitude or significance. * P<0.05, ** P<0.01, *** P<0.001, p-values by ANOVA based on mutation status with PIB MCBP score as a covariate. Non-carriers, blue circles; mutation carriers PIB− (MC PIB−), green squares; mutation carriers PIB+ (MC PIB+), red triangles. Each point represents one participant.

