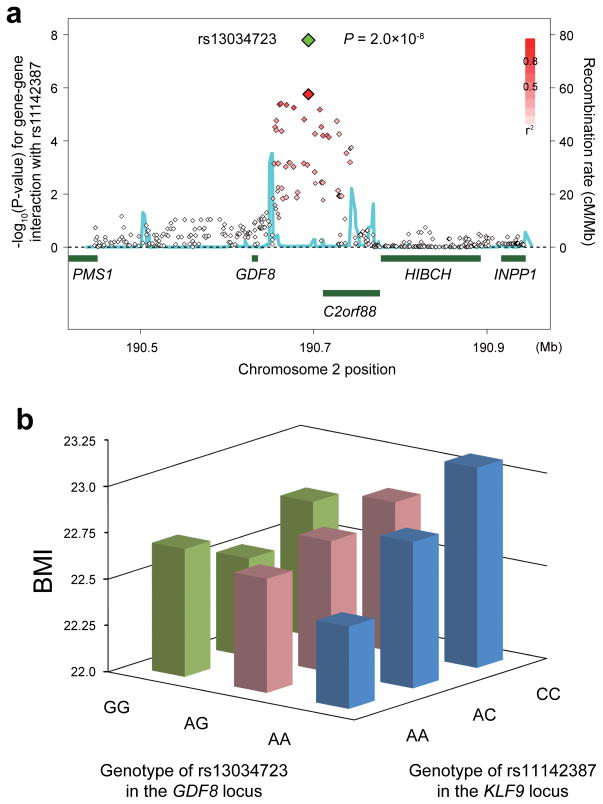
Figure 2.
Gene–gene interaction between the KLF9 and GDF8 loci. (a) Regional plots of the SNPs. Diamond-shaped dots represent −log10 (P-values) of the SNPs for gene–gene interaction with the landmark SNP in the KLF9 locus (rs11142387). The green dot indicates the P-value of the most significantly associated SNP in the combined study, and the red dot indicates its P-value in the genome-wide gene–gene interaction analysis. The density of the red color in the small-sized dots represents the r2 value with the most significantly associated SNP of the large-sized red dot. The blue line shows the recombination rates given by the HapMap database. The lower part indicates the RefSeq genes in the locus. (b) Mean BMI values of the subjects stratified with the genotypes of rs13034723 in the GDF8 locus and rs11142387 in the KLF9 locus.

