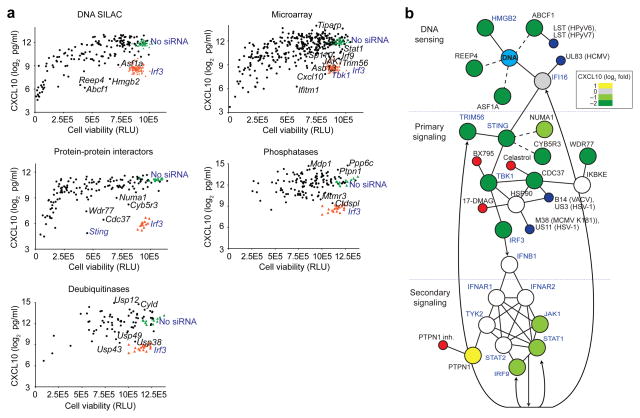
Figure 2.
RNAi screen defines functional components of the ISD-sensing pathway. (a) siRNA screening assay showing CXCL10 concentration in supernatants of MEFs treated with siRNA and stimulated with DNA (ISD sequence), plotted against cell viability (in relative light units, RLU) after siRNA treatment to control for potential cytotoxic effects of the siRNAs. Black dots, siRNAs; orange triangles, siRNA targeting Irf3 (siIrf3) positive controls; green triangles, no siRNA; selected genes are labeled; control genes are labeled. Data represent averages of three biological replicates for each siRNA. (b) Representation of protein-protein interactions among known and new proteins involved in the ISD-sensing network based on published and our protein-protein interaction data sets. Blue text, known ISD-sensing pathway components; solid lines, interactions defined in other data sets; dashed lines, interactions defined in our data sets; arrows, transcriptional regulation; green, gray and yellow circles, screened by siRNA and colored by CXCL10 values relative to no siRNA control; white circles, toxic siRNA or not screened; blue circles, viral protein; red circles, chemical inhibitor.

