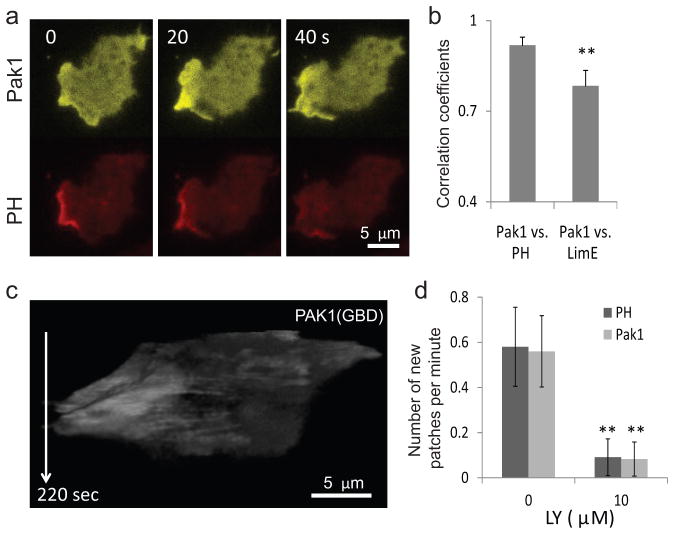
Figure 3. Rac activity correlates with the dynamics of the signaling network.
(a) Frames from a time-lapse TIRF video of a cell co-expressing PAK1(GBD)-YFP and PH-RFP. (b) Correlation between pairs of biosensors expressed in the same cells (left: WT cells co-expressing Pak1(GBD)-YFP and PH-RFP; right: WT cells co-expressing PAK1(GBD)-YFP and LimE-RFP; n=10 each, gray bars: mean, error bars: S.D., **p<0.001, t-test). (c) T-stack of a cell expressing the Rac biosensor PAK1(GBD)-YFP showing the absence of fast oscillations. (d) Effect of LY treatment on the frequency of new patches in cells expressing PAK1(GBD)-YFP and PH-RFP observed by confocal microscopy (n=10 cells each; ** p<0.001, t-test).

