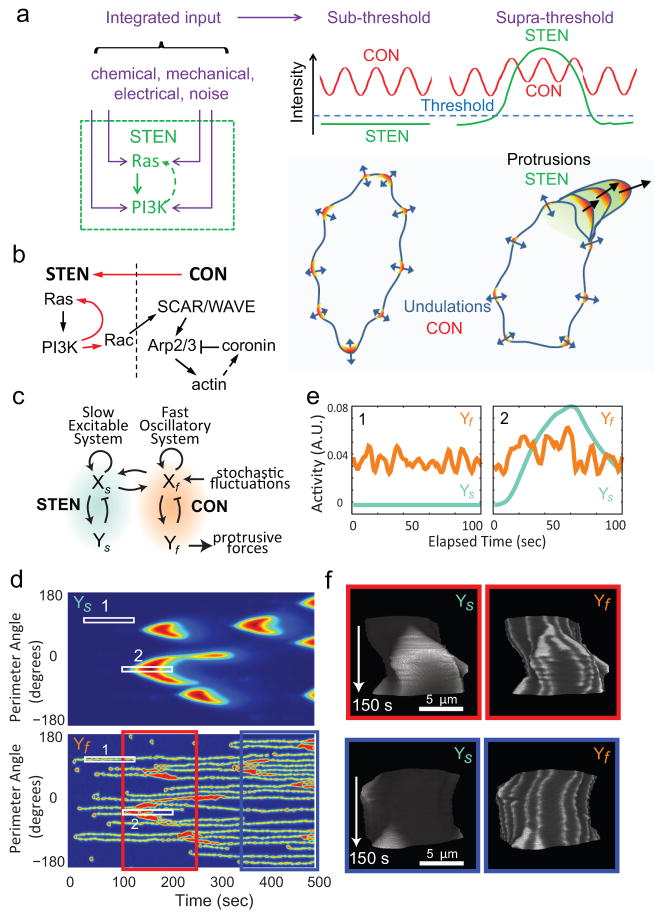
Figure 5. The STEN-CON coupling model and computer simulation.
(a) In the STEN-CON coupling model, inputs from various sources enter STEN at different points. When the integrated input reaches a threshold level, STEN becomes fully activated and by coupling to CON causes large protrusions. Without STEN activation, the cytoskeletal oscillations only cause small amplitude undulations of cell boundary. (Note that the stochastic LimE flashes, similar to those reported by Uchida and Yumura 37, were not accompanied by HSPC300 recruitment and were not considered part of CON in our definition despite a similar lifetime of activities as discussed in the main text.). (b) Schematic of the links between components of the STEN and CON. Red arrows highlight the links demonstrated in this study. (c) The behavior of STEN and CON were modeled using reaction-diffusion equations describing coupled slow (Xs, Ys) and fast (Xf, Yf) activator-inhibitor systems solved in one dimension around a circle (see Supplementary Methods for details). (d) Kymograph describing the activities of the slow (Ys) and fast (Yf) systems around the perimeter of the circle using jet colormap. (e) Intensity plots of the slow and fast systems corresponding to Boxes 1 and 2 in (d). (f) The activities of the slow and fast systems were used to control the boundary of a hypothetical cell (Supplementary Video S11). T-stacks of the activities of Ys and Yf on the boundary of the hypothetical cell with gray colormap corresponding to the period from 100s to 250s (red box) and 350s to 500s (blue box) in (d) are shown.

