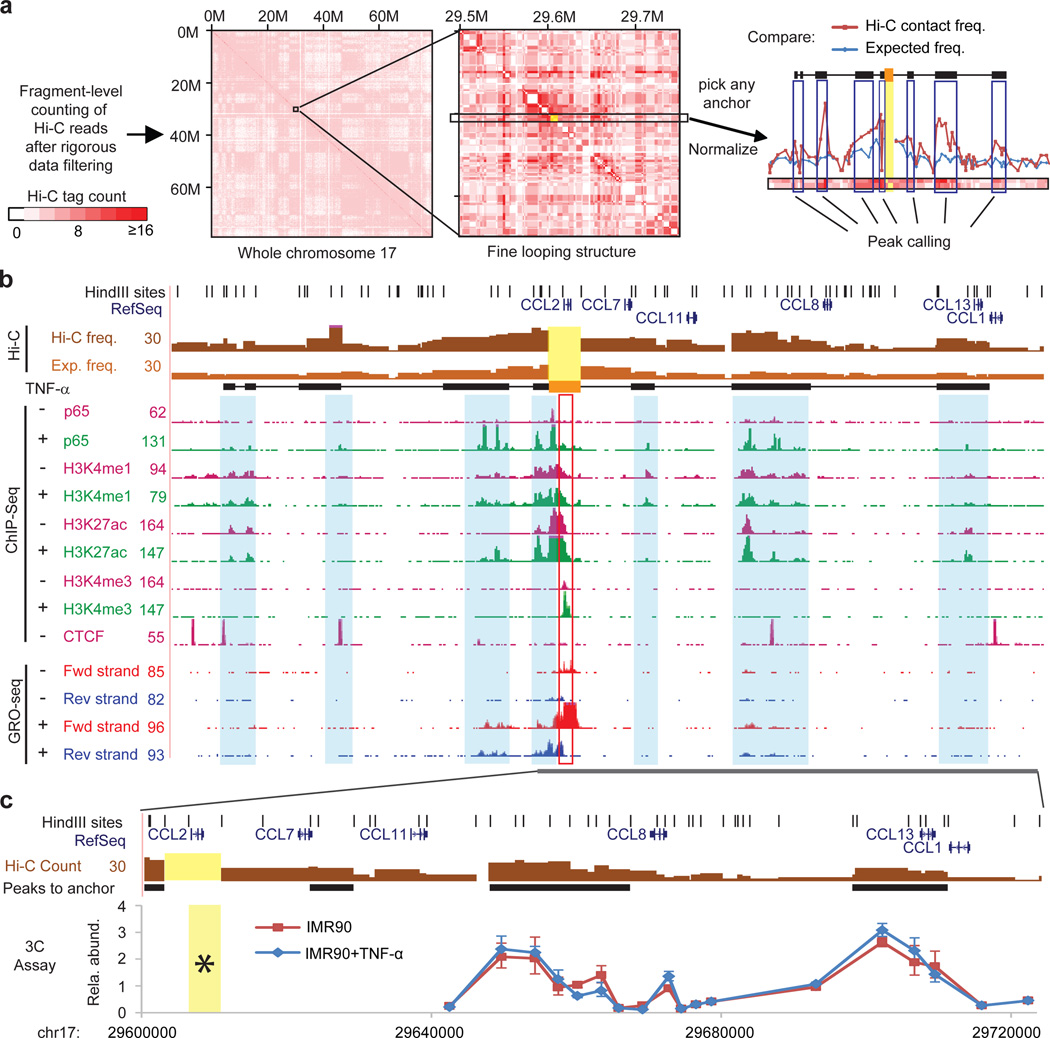
Figure 1. Fine mapping of chromatin interactions in IMR90 cells.
a, An illustration of the Hi-C data analysis procedure to identify regions interacting with a selected genomic region, such as the CCL2 locus as highlighted in yellow (Supplementary Method). b, Genome browser shot of the CCL2 locus showing the results from Hi-C, ChIP-seq and Gro-seq experiments. Each bar in the top 2 tracks are either Hi-C reads count (dark brown) or expected frequency (light brown) from a fragment to CCL2 locus (highlighted in yellow and orange filled box). Black filled boxes are regions interacting with CCL2 called by the peak calling algorithm same as the black filled boxes in (a). Light blue shadows highlight the enhancer/CTCF locations from ChIP-seq data. CCL2 is induced by TNF-α (shown in the GRO-Seq tracks). c, Validation of the DNA looping interactions with CCL2 using 3C assays. Yellow: anchor fragments in Hi-C or 3C (with star). Error bar: s.d. from 3 PCR replicates.

