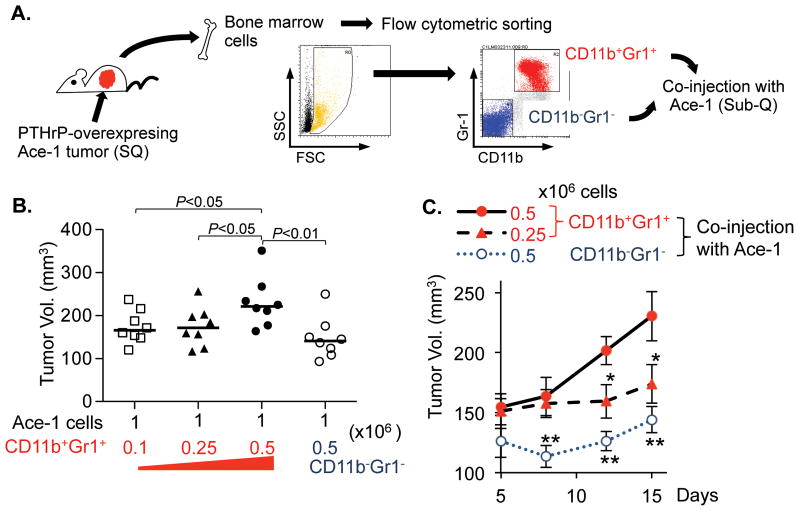
Fig. 3. CD11b+Gr1+ cells promoted tumor growth in vivo.
(A) Schematic representation of the experiment. Male athymic mice were implanted with PTHrP overexpressing Ace-1 tumors for 21 days prior to harvesting femoral bone marrow cells. Flow cytometric sorting resulted in two fractions of CD11b/Gr1-double positive or double negative cells, followed by their co-injection with parental Ace-1 cells subcutaneously in male athymic mice (n=8 per group).
(B) Individual tumor size was measured 15 days after xenograft and plotted on a graph. Dots: individual tumor volumes (mm3). Horizontal lines: medians. P values are from Student’s t-test.
(C) Tumor growth curve was plotted to compare growth kinetics. Data are mean±SEM. * P<0.05 and ** P<0.01, Student’s t-test

