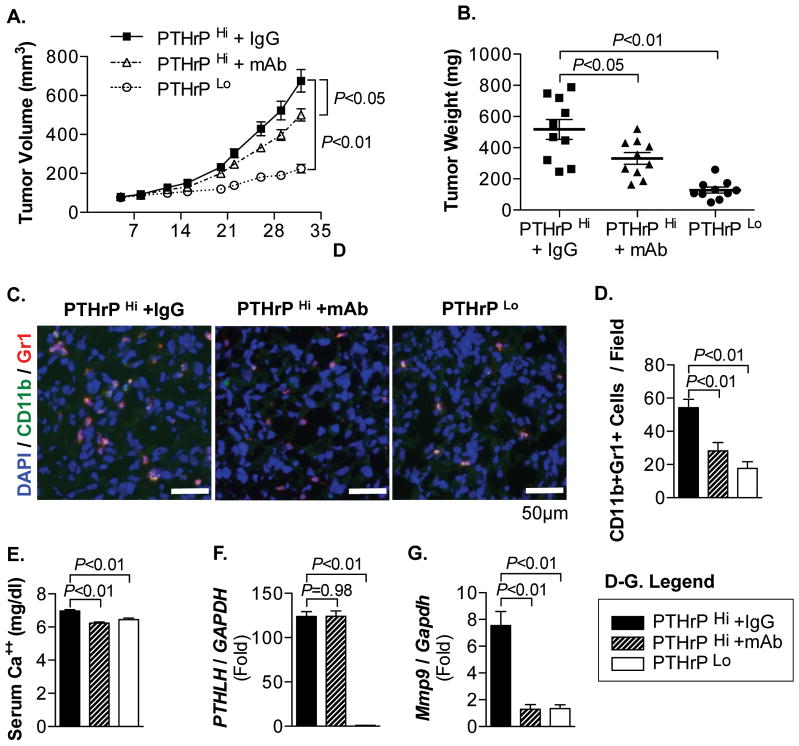
Fig. 7. Anti-human PTHrP monoclonal antibody decreased MDSC recruitment in PC-3 tumors.
(A) Tumor growth curve of PC-3 PTHrPHi tumors treated with control IgG or anti-PTHrP monoclonal antibodies (mAb), and PC-3 PTHrP Lo tumors (n=10/group). Both P values are from linear regression comparison with PC-3 PTHrPHi IgG tumor group. Data are mean±SEM.
(B) Individual tumor weight was measured upon necropsy and plotted. Dots: individual measurements (mg). Horizontal lines: mean±SEM. (n=10/group).
(C) Tumor tissues were sectioned and stained for CD11b (Alexa-Fluor 488), Gr1 (Alexa-Fluor 546), and DAPI. Original magnification, ×40. Scale bars: 50μm
(D) Immunofluorescent images were merged and analyzed for CD11b+Gr1+ cell per microscopic field. Three positively stained non-necrotic tumor areas were randomly selected for quantification (5 tumors/group).
(E) Sera were collected upon necropsy, followed by calcium assay.
(F and G) PTHLH or Mmp9 mRNA levels in the pulverized tumor tissue were measured by quantitative RT-PCR (n=10/group). Data in all bar graphs are mean±SEM. All P values, unless indicated otherwise, are from Student’s t-test.

