
Figure 1.
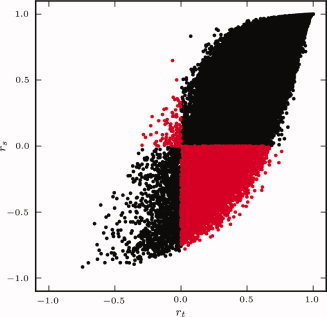
Comparison of r t and r s similarity metrics calculated from the resting state data of a single subject. Each point corresponds to a pair of voxels. Voxel pairs for which one metric is positive and the other is negative are shown in red. [Color figure can be viewed in the online issue, which is available at wileyonlinelibrary.com.]