
Figure 6.
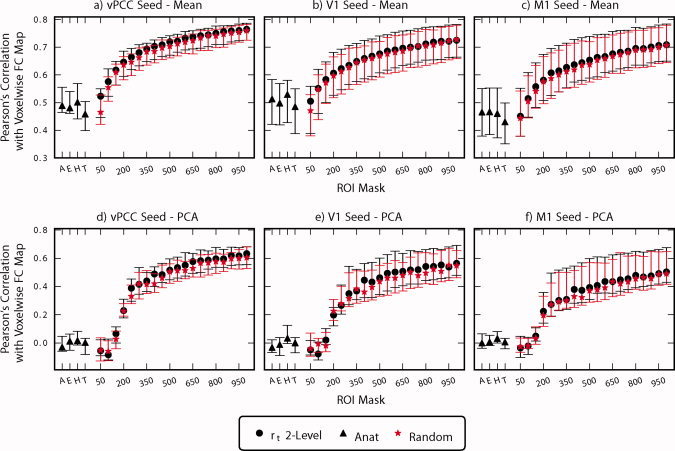
Comparison of accuracy of representation for r t 2‐level functional parcellation, anatomical atlas (A: AAL, E: Eickhoff‐Zilles, H: Harvard‐Oxford, T: Talairach and Tournoux), and random parcellation. Symbol is located at the mean and error bars indicate standard deviation. Voxel‐wise FC maps for vPCC (ventral posterior cingulate cortex), M1 (left primary motor cortex), and V1 (primary visual cortex) were compared to ROI‐wise FC maps calculated from the same seeds using Pearson's correlation. ROI summary time courses were derived either by averaging (a–c) or using the first eigenvariate of a principle components analysis (PCA) (d–f).