
Figure 7.
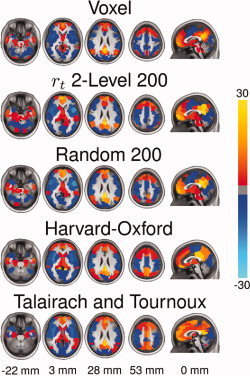
Comparison of voxel‐wise FC map of the default mode network to maps generated from a 200 ROI parcellation using r t 2‐level, random parcellation, the Harvard‐Oxford atlas and the Talairach and Tournoux atlas. FC maps were Fischer transformed, combined across subjects using a one‐sample t‐test and converted to z‐scores. No threshold was applied to the images.