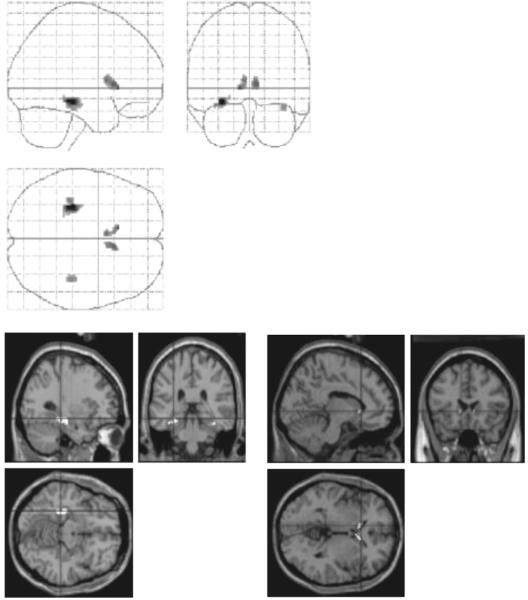
Figure 4.
Learning-related decreases in activation, all sequence learning conditions versus random implicit condition. The upper panel shows a maximum intensity projection of the SPM(t) for regions showing a time-dependent increase in (activation relative to recurring visual fixation) that are significantly greater than any seen during random implicit condition. Left MTL showed a significant effect (FDR < 0.05) and left caudate showed a trend towards a decrease (FDR = 0.08). The SPM is thresholded at P < 0.01 (uncorrected for multiple comparisons) in order to show the small trend towards additional activations on the right. The lower panel shows superimpositions of MTL (left: image sectioned at coordinates x, y, z = −30, −32, −12) and caudate activations (right: x, y, z = −10, 20, 0) on a representative structural MRI rendered into the same anatomical space.

