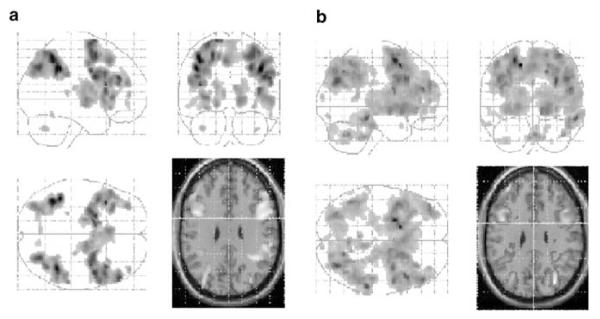
Figure 2.

(a) SPM showing the contrast between manipulation and maintenance conditions collapsed across load for the placebo condition. ‘Glass brain’ images are presented showing coronal, sagittal, and axial views. In order to identify the localization of main frontal and parietal activations, these are mapped onto a standard anatomical image in the same space at 30 mm above the ac-pc line. Images are presented at p<0.05 (FDR corrected). Clusters less than 10 contiguous voxels have been excluded. (b) SPM showing the contrast between manipulation and maintenance conditions collapsed across load for the ketamine conditions. Images are prepared and represented as described above.
