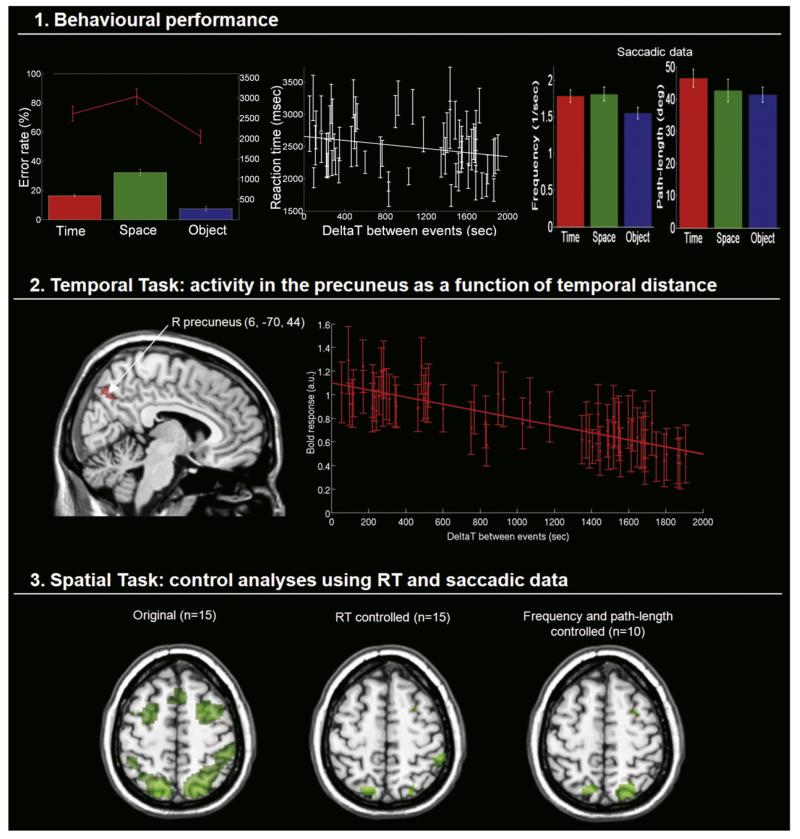
Fig. 2. Behavioural data, temporally modulated activity in the precuneus, and control analyses in the Spatial task.
Panel 1: (a) Mean error rates (%) and reaction times (ms) across the three retrieval tasks; (b) reaction times plotted against temporal distance (DeltaT) for high consistency trials of the Temporal task, showing a significant negative correlation (p=0.045); (c) Saccadic data obtained in 10 subjects, histograms depicting the median saccadic frequencies (1/s; on the left) and mean saccadic path-lengths (deg; on the right) executed during the 5-s trials across tasks. Panel 2: Cluster of activation (in red) in the right precuneus modulated as a function of temporal distance (x, y, z=6, −70, 44; p-FWE<0.007), with the corresponding BOLD response (a.u.) plotted against DeltaT. The activation data for this plot were extracted from subject-specific fitted-responses (first level analyses), 5 scans after the onset of the Temporal trials. Panel 3: Clusters of activation in the dorsal fronto-parietal network that activated selectively in the Spatial task in: (a) the main analysis; (b) control analysis accounting for differences in task difficulty between conditions (reaction times as a covariate of no interest); and (c) control analysis accounting for differential patterns of eye movements between conditions (saccadic frequency and path-lengths, in a sub-group of 10 subjects). Activations are displayed at p-unc.=0.001. Error bars: Standard error of the mean.

