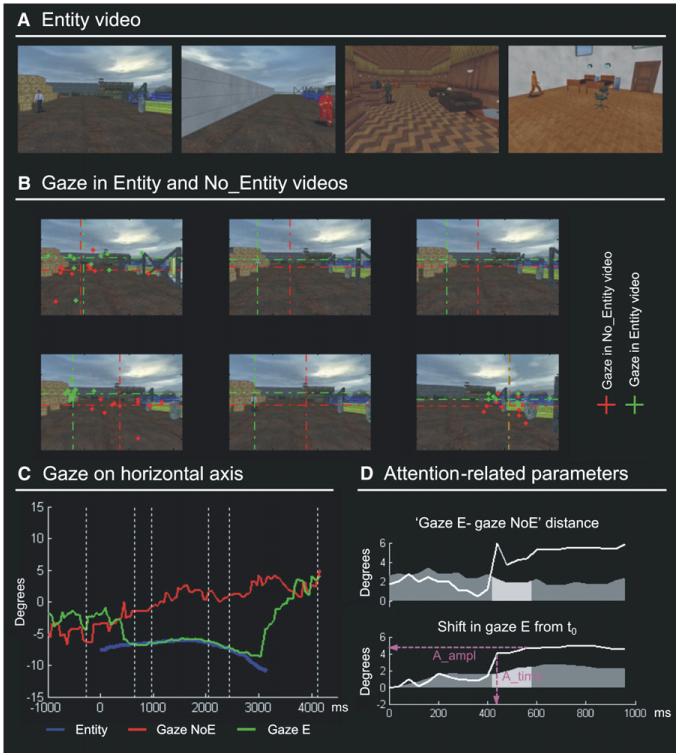
Figure 2. Entity Video: Examples and Computation of the Attention Parameters.
(A) Examples of a few frames of the Entity (E) video showing different characters in the complex environment.
(B) Gaze position during the free viewing of a video segment when the character was present (Entity video, gaze position plotted in green) or when it was absent (No_Entity video, gaze position plotted in red). This shows comparable gaze positions in the first frame (character absent in both videos), a systematic shift when the character appears in the Entity video (frames 2–5), and again similar positions after the character exited the scene (frame 6). The dashed crosses represent group-median gaze positions, and dots show single subjects’ positions.
(C) Time course of the group-median horizontal gaze position for the same character shown in (B) (viewing of the Entity video in green; viewing of the No_Entity video in red). The blue trace displays the horizontal position of the character over time, showing that subjects tracked the character in the Entity video (green line). Vertical dashed lines indicate the time points corresponding to the six frames shown in (B).
(D) Computation of the attention parameters (A_time and A_ampl) for the same character. The attention grabbing properties of each character are investigated by applying a combination of statistical criteria on gaze position traces (see Experimental Procedures section for details), two of which are demonstrated here. The top subplot shows the Euclidian distance between gaze positions during the viewing of the Entity and No_Entity video, plotted over time. The bottom subplot shows the shift of gaze position during the viewing of the Entity video, compared with the gaze position in the first frame when the character appeared (time = 0). The two attention parameters were computed by assessing when both distances exceeded the 95% confidence interval (dark gray shading in each subplot) for at least four consecutive data points (light gray shading). The time of the first data point exceeding the thresholds determined the processing time parameter (A_time), while the amplitude parameter (A_Ampl) was measured in correspondence with the last data point of the window; see magenta lines.

