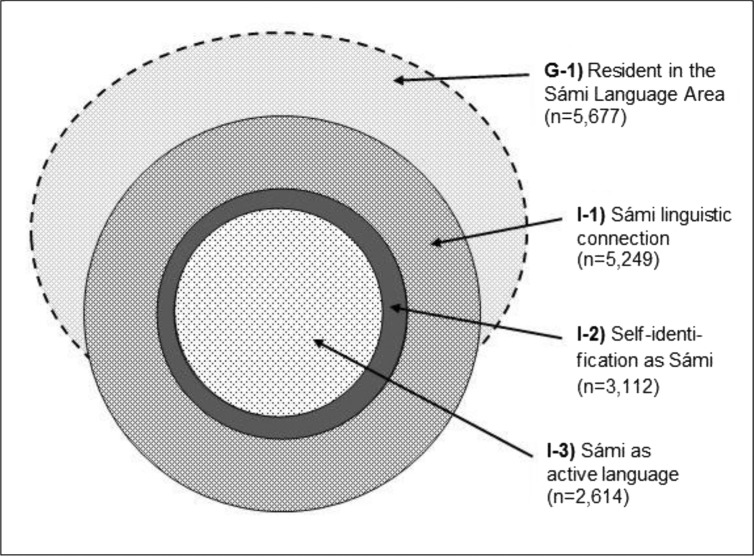
Fig. 3.
Schematic illustration of 4 Sámi populations aged 36–79 years as of 2003–2004 in 17 municipalities in Norway north of the Arctic Circle – defined according to different but partially overlapping Sámi inclusion criteria*.
*The size and relative position of each circle is indicative. Assignment to I1–I3 is based on self-reported data.

