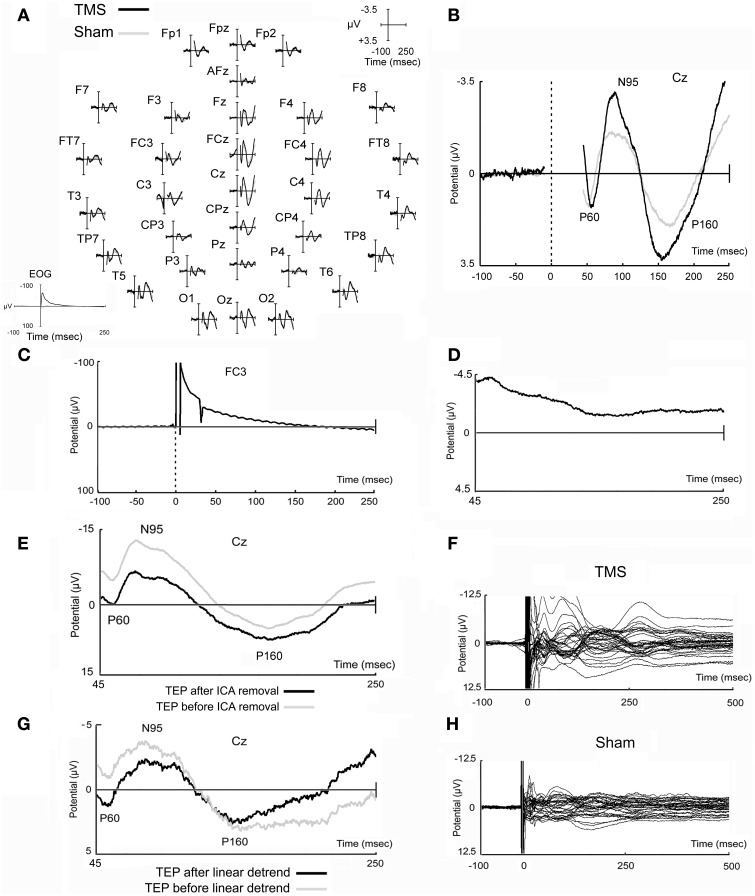
Figure 2.
Real and sham TMS-evoked potentials. Evoked potentials obtained in real and sham TMS conditions as recorded in all electrodes (A) and in the representative Cz electrode (B). In EOG data, TMS artifact is fully reported and appears longer likely due to filtering settings (A). Potential that has been obtained in a prototypical electrode after the stimulation of the watermelon is also shown (C), as well as a prototypical independent component, evidently related to TMS artifacts, that has been removed from data (D). A TMS-evoked potential of a prototypical subject before and after ICA removal is also represented (E). Finally, the butterfly plots of the grand-averaged TMS and sham raw data (before ICA decomposition and removal, and before linear detrend) are shown (F,H) in order to highlight that data tend to the baseline after the last components that appeared at about 250–300 ms after the delivery of the magnetic stimuli. An example of data before and after linear detrend is also shown (G).

