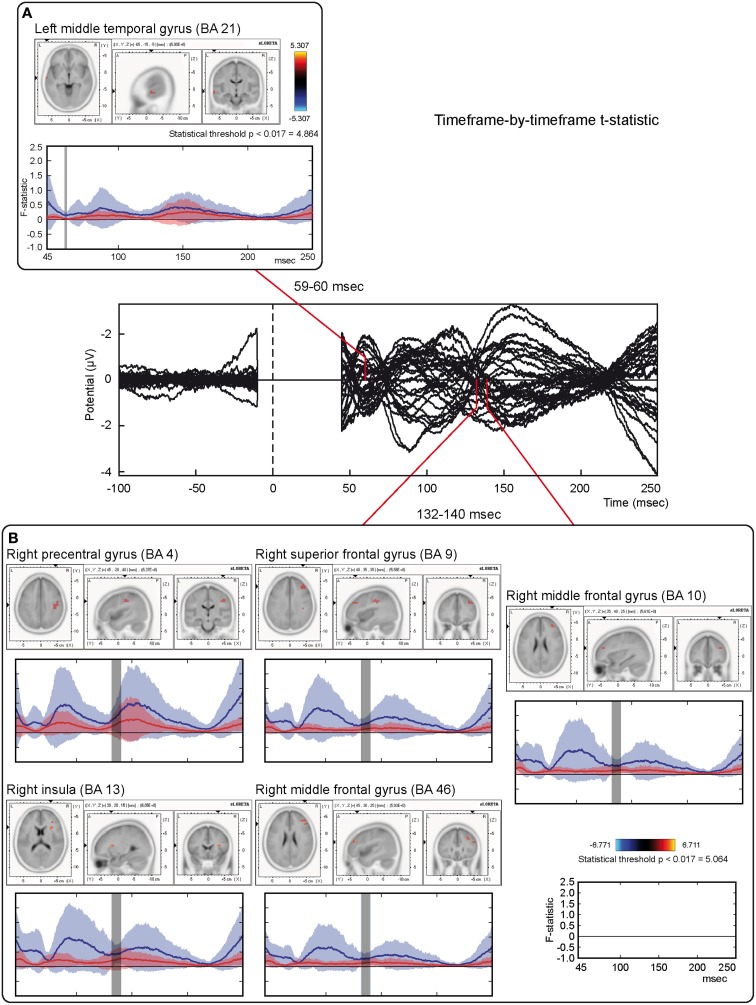
Figure 4.
Time-frame by time-frame sLORETA results (1). Principal sLORETA results obtained when considering a time-frame by time-frame analysis performed with t-statistic and comparing real TMS minus sham conditions. Images are plotted with respect to the time windows identified in a butterfly plot of the evoked potentials obtained from the real TMS condition. (A) Results obtained in the 59–60 ms time window. Activation with the maximal peak in the left middle temporal gyrus (BA 21) is shown. (B) Results obtained in the 132–140 ms time window. Activations with the maximal peaks in the right sensorimotor and frontal regions (BA 4, 9, 10, 13, and 46) are shown. The time course of the intensity of the signal in the source space is also shown. Specifically, real TMS signals for a specific peak (corresponding to a specific voxel) are indicated by a blue line (standard deviations are indicated by shadows of the same color). Sham signals for the same peak (and voxel) are indicated by a red line (standard deviations are indicated by shadows of the same color). The corresponding significant time-frames are indicated by gray shadows. It is very important to note that the intensity of the signal in the source space has, here, the form of an F-statistic, since sLORETA perform the standardized estimate of the cortical current density, expressed as a statistical value (F-distribution value; Pascual-Marqui, 2002).

