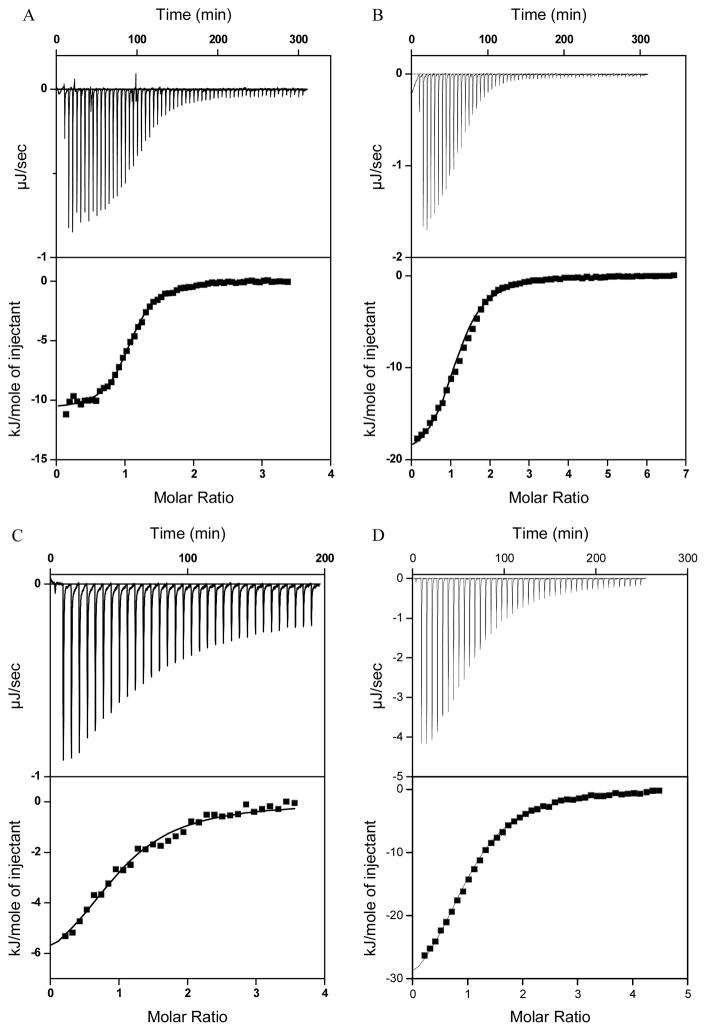
Figure 2.
Examples of ITC experiments showing the binding of TRTK12 to S100B, S100A1, S100A2, and S100P in the presence of calcium. Upper plots in each panel represent the raw heat effects as a function of time and lower plots show the cumulative heat effects (●) as a function of the molar ratio of peptide to protein, and the fits to the experimental data using Eq. 1 (—) for binding of TRTK12 to S100B at 25 °C (A), binding of TRTK12 to S100A1 at 25 °C (B), binding of TRTK12 to S100A2 at 25 °C (C), and binding of TRTK12 to S100P at 25 °C (D).

