
Figure 2.
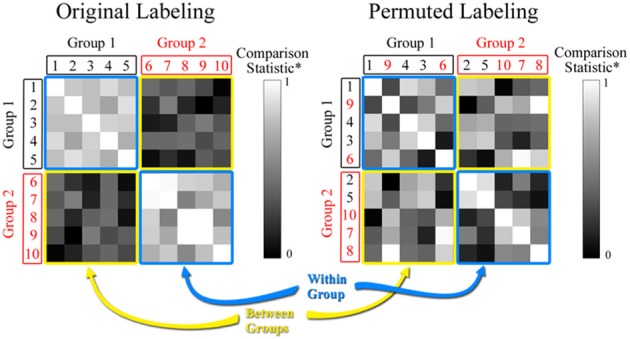
Comparison statistic (Jaccard index and K-S statistic) matrix. The figure shows hypothetical data for 2 groups each with 5 subjects. The value in each cell of the matrix represents the similarity between the two subjects based on either the Jaccard or the rescaled K-S statistics. The permuted matrix results in a scrambling of the group assignment for subjects based on random selection. Note that subjects 2 and 5 have been moved to Group 2 and subjects 9 and 6 have been moved to Group 1.