
Figure 8.
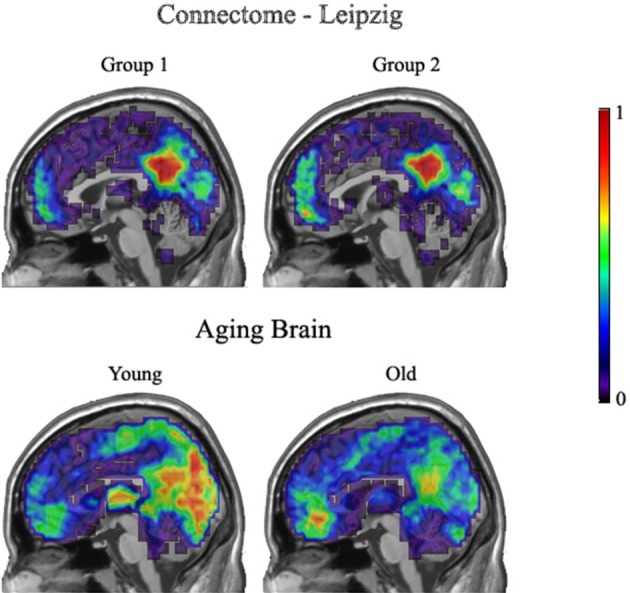
Leipzig and Aging Brain analysis results. Each image is a sagittal slice of an overlap of every member in a group at a threshold of 20%. The images are normalized by dividing by the number of subjects in each group, resulting in values between zero and one.