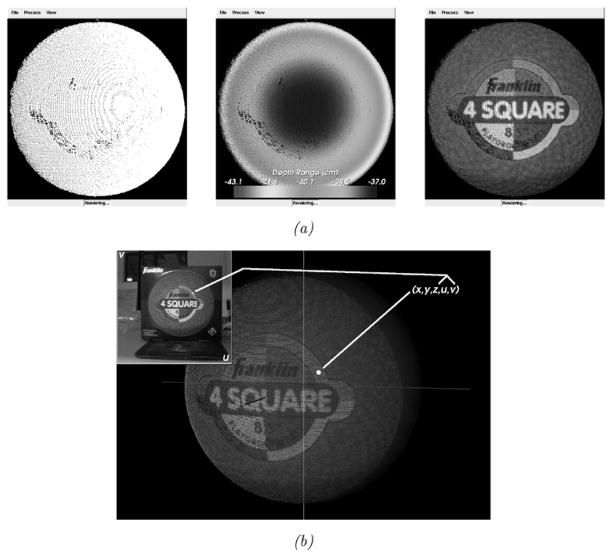
Fig. 2.
Different representations of data acquired by the LRS device and the texture mapping process. (a) From left to right, raw range points, range points colored according to their distance (in Z) from the origin of the scanning space, and the textured point cloud generated after texture-mapping. (b) A visualization of the texture mapping process.

