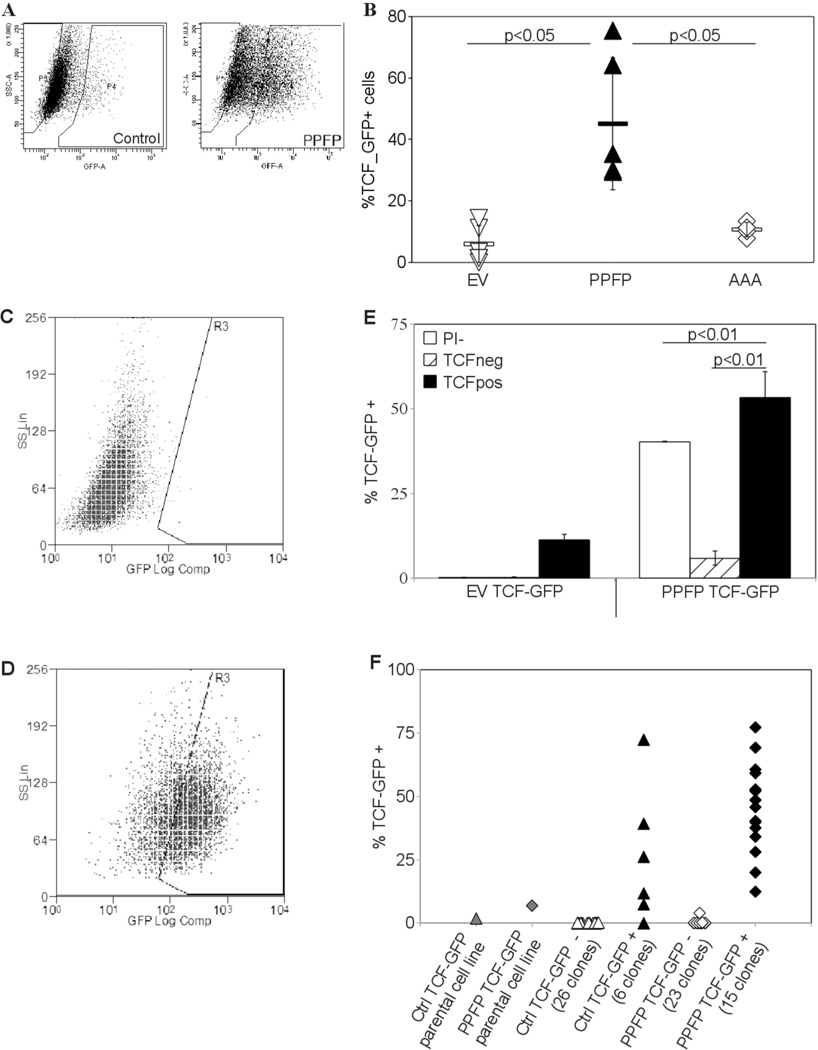
Figure 2.
(A) Increased TCF driven GFP expression in PCCL3-PPFP cells. Empty vector control PCCL3 and PCCL3-PPFP cells were infected with lentiviral constructs carrying a GFP gene driven by a TCF responsive promoter. Cells which expressed GFP after 5 days in culture were sorted out and expanded to create 100% transfected cell lines. These cell lines were analyzed for GFP expression by flow cytometry. Gates were set at the level of GFP expression in 99.5% of control cells expressing GFP under the control of the same promoter without TCF response elements. Test samples with GFP levels higher than gated were considered GFP positive and TCF responsive. (B) Increased TCF_GFP positivity in multiple PPFP cell lines versus empty vector control and AAA cells. Empty vector control PCCL3-EV, PCCL3-PPFP, and PCCL3-AAA cell lines were infected with the TCF reporter construct as described in (A) and analyzed via flow cytometry. Each point on the graph represents an independent cell line. Results are typical of many (>3) repeated experiments. (C, D) Re-establishment of TCF heterogeneity by TCF_GFP+ cells. The GFP+ and GFP- fractions were placed in culture and analyzed after 5 days. The fractions were analyzed for TCF_GFP expression: (C) was a typical GFP-fraction and (D) was a typical GFP+ fraction in culture, 5 days after sorting. (E) Cells were sorted according to their GFP expression status and analyzed after 5 days in culture as described in (C,D). A whole population sample for each cell line (gated on cell viability only, denoted PI-) was also sorted through the flow cytometer during the same sorting session and analyzed with the other fractions. Results are means ± SD and were repeated with independent cell lines. (F) Re-establishment of TCF heterogeneity in cell lines derived from single TCF_GFP+ cells. Single cells were sorted into each well of a 96 well plate based on their GFP status, and grown into cell lines which were analyzed by flow cytometry. Each point on the graph indicates a cell line derived from a single cell, the GFP status of which is indicated below the X-axis. The experiment was repeated and similar results obtained.

