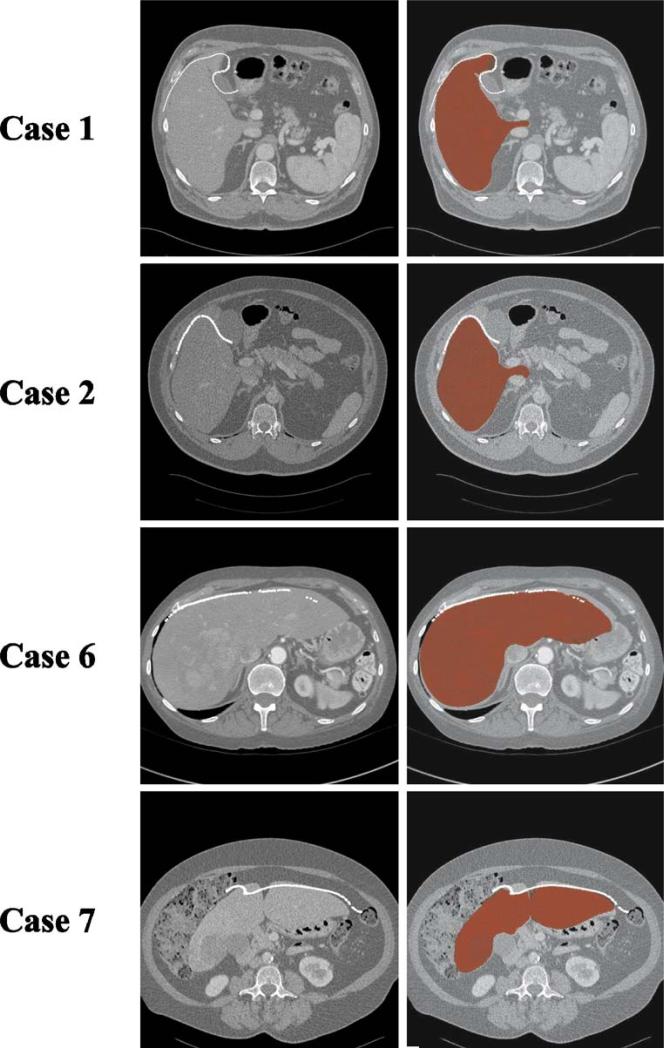
Figure 10.
Left column—Original rigid registration of range scan data overlaid on tomograms. Right column—The deformed liver volume from the finite element model is overlaid in red. In the areas where the point cloud was used for the boundary conditions, there is improved agreement between the range scan surface and the deformed image surface.

