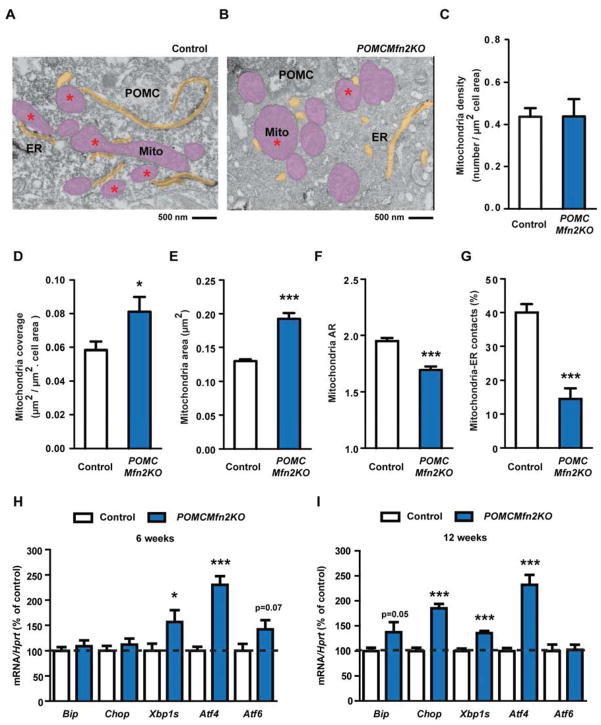
Figure 6. Deletion of Mfn2 in POMC neurons alters mitochondrial morphology, mitochondrial-ER contacts and induces ER stress.
(A–B) Representative electron microscopy images of POMC neurons from 12-week old male control (A) and POMCMfn2KO (B) mice. Mitochondria (Mito: pink areas) and endoplasmic reticulum (ER: yellow areas) are shown. Red asterisk shows mitochondria in contact with ER.
(C) Mitochondria density, (D) mitochondria coverage, (E) mitochondria area and (F) mitochondria aspect ratio (AR) in POMC neurons from 12-week old male control (n=5; 1198 mitochondria from 30 POMC neurons) and POMCMfn2KO (n=3; 530 mitochondria from 15 POMC neurons) mice.
(G) Percentage of mitochondria-ER contacts in POMC neurons from 12-week old male control (n=5; 32 POMC neurons) and POMCMfn2KO (n=3; 17 POMC neurons) mice.
(H) Gene expression analysis of ER-stress markers in the hypothalamus from 6-week old male control (n=10–15) and POMCMfn2KO (n=8–12) mice.
(I) Gene expression analysis of ER-stress markers in the hypothalamus from 12-week old male control (n=21–23) and POMCMfn2KO (n=16–18) mice. Probe for Hprt was used to adjust for total RNA content.
Data are expressed as mean ± SEM. *P<0.05; ***P<0.001. See also Figures S5.

