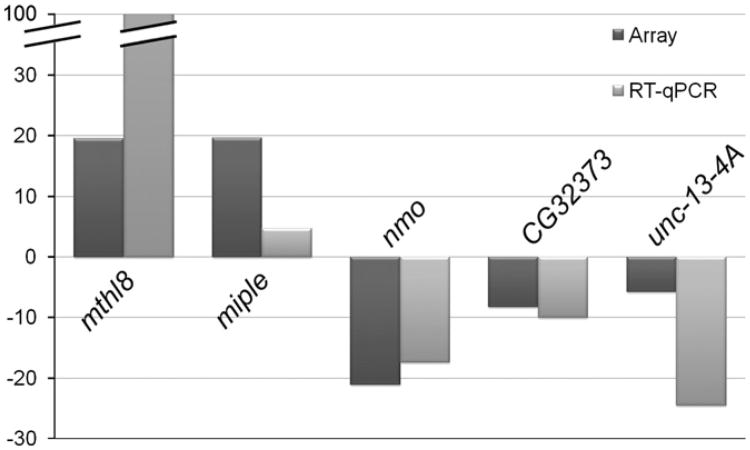
Fig. 3.
Correlation of the differential expression of candidate genes in arrays and RT-qPCR. Graphic representation of fold changes in the expression levels of nmo and four candidate genes identified in the microarray analyses of armGFP, nmoP1 eye imaginal discs. Comparisons between the fold change values obtained in RT-qPCR and microarray analyses are shown.

