
FIG. 5.
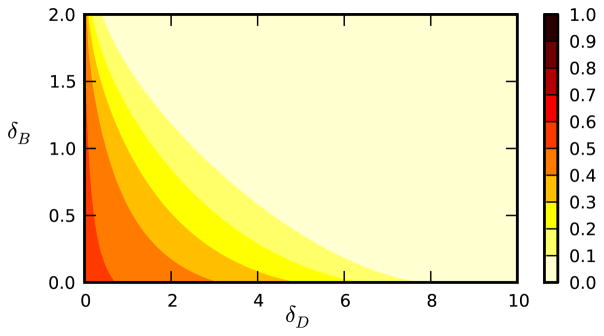
Computed final proportion infected for epidemics with behavior change. We use networks of the same structure as in Figure 3. The disease spreads with β = 2, γ = 1. The values of δB and δD are varied. For the initial condition, no individuals have changed behavior and a proportion 10−6 is initially infected randomly.