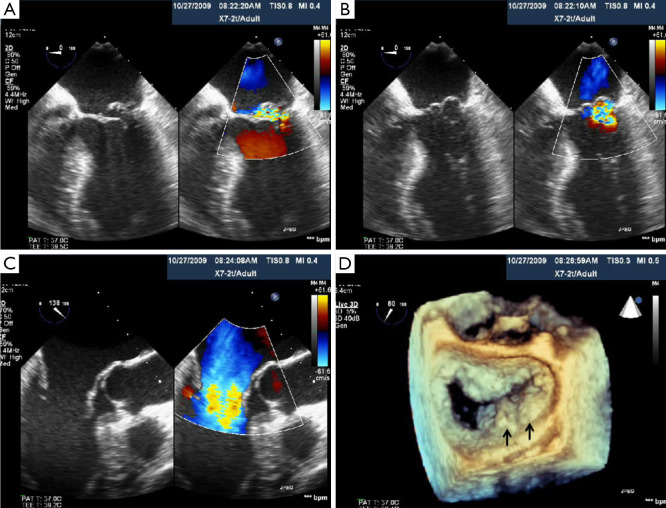
Figure 25.
A-B. 2D TEE 4 Chamber views show prolapse and flail of the middle scallop (P2) with associated MR; C. 2D 3 chamber long axis view also shows middle scallop (P2) prolapse and flail; D. 3D RT TEE show flail medial and middle scallops (P2 and P3) (From Siegel et al. Int J Cardiovasc Imaging 2011, in press, with permission)

