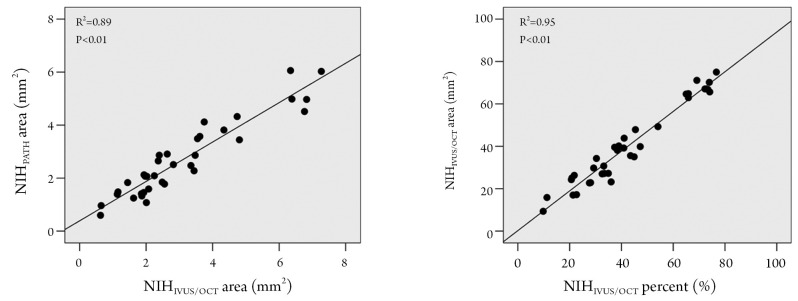
Figure 2.
Correlations between measurements by IVUS/OCT and traditional pathological definitions. In the left panel, correlation graph between neointimal areas, measured according to IVUS/OCT definition and traditional pathological definition. In the right panel, correlation graph of percent neointimal obstruction by IVUS/OCT definition versus the percent obstruction by the traditional pathological criterion (for definitions see Figure 1)

