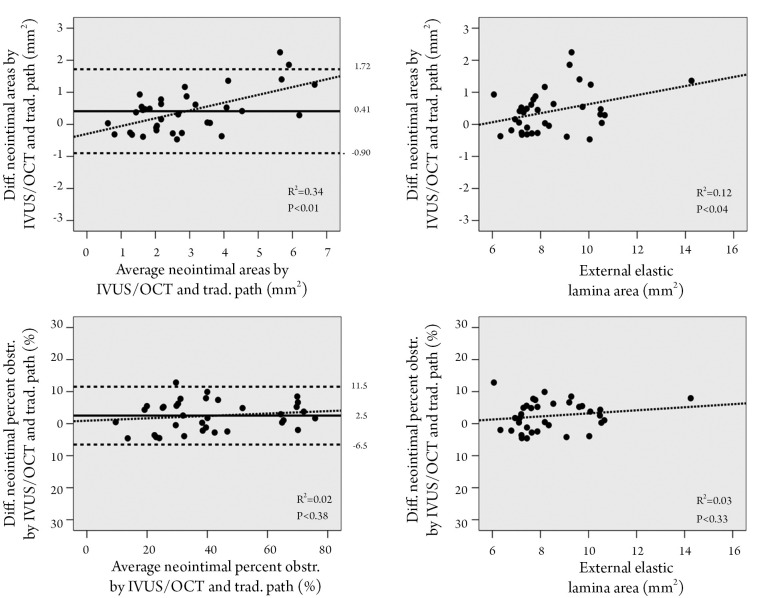
Figure 3.
Analysis of the differences between measurements by IVUS/OCT and traditional pathological definitions. A. Bland and Altman graphs to evaluate the differences between the traditional histopathological and IVUS/OCT-like measurements for neointimal area (upper panel) and for percent neointimal obstruction (lower panel). The average of the two measurements is plotted against the difference between them. Continued lines represent the mean difference in measurements and the horizontal traced lines represent the 95% confidence interval for the difference in measurements. The additional traced line represents the correlation between the variables; B. Difference between the IVUS/OCT-like and the pathology-like measurements for neointimal area (upper panel) and for percent neointimal obstruction (lower panel), as a function of vessel size (inferred by the external elastic lamina area. The additional traced line represents the correlation between the variables (for definitions see Figure 1)

