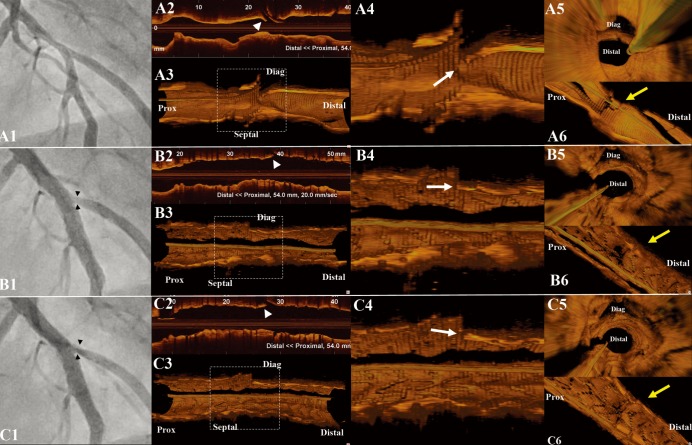
Figure 2.
[1] Magnified angiographic view of the lesion, [2] longitudinal renderings, and three-dimensional renderings of OCT images with [3] transversal cutaway views and [4] zoomed images (corresponding to the white dashed boxes of 3), [5] downstream fly-through views, and [6] cutaway views perpendicular to the ostium of the side-branch from (A) before intervention, (B) after stent implantation, and (C) after post-dilation. Black arrowheads at panels B1 and C1 indicate the side-branch pinching. White arrowheads at panels A2, B2, C2 indicate the spiky carina (‘eyebrow’ sign), and the shift towards the side-branch following intervention. White arrows at panels A4, B4, C4 indicate the carina and the shift towards the side-branch following intervention. Note the upward shift of the carina at panels A5, B5, C5 and the reduction of the area of the side-branch ostium. Yellow arrows at panels A6, B6, C6 indicate the ostium of the diagonal branch and the effect of carina shift following intervention. Abbreviations: GW = guidewire, LAD = left anterior descending artery, diag = diagonal branch, septal = septal branch

